
Housing Price Indicies: Sept.
In September, the seasonally-adjusted home prices of single-family units rose in 11 of the 20 metro areas tracked by the S&P/Case-Shiller Housing Price Indicies. Despite those increases, sales price levels in all 20 markets remain significantly lower than they were one year ago. 
The graph (right) shows changes in price indices for selected metros. Data are shown for Charlotte, certain peer metros in the South Atlantic, and, for purposes of regional comparisons, San Diego and Cleveland. The composite measure for all 20 metros also is shown.
While Charlotte never experienced the same housing bubble seen in other metros, housing prices, as measured by the index, have fallen by 8.1 percent over the past year. And Charlotte was one of nine metros tracked in the survey that recorded a month-to-month decline in prices. Although most of the price tracked by the S&P.Case-Shiller Indicies have risen over the past few months, those trends don’t necessarily mean that the housing bubble has fully deflated. Explains Calculated Risk:
It appears that house prices – in general – are still too high. However prices depend on the local supply and demand factors. In many lower priced bubble areas supply has declined sharply (because of the loan modification efforts and local moratoria), and demand was very strong in Q3 from the first-time home buyer frenzy and cash flow investors. This has pushed up prices at the low end, and suggests price might fall some again at the low end – although probably not to new lows.
…
However in the mid-to-high end of the bubble areas – with significant supply and little demand – prices are still too high.

 Email Sign-Up
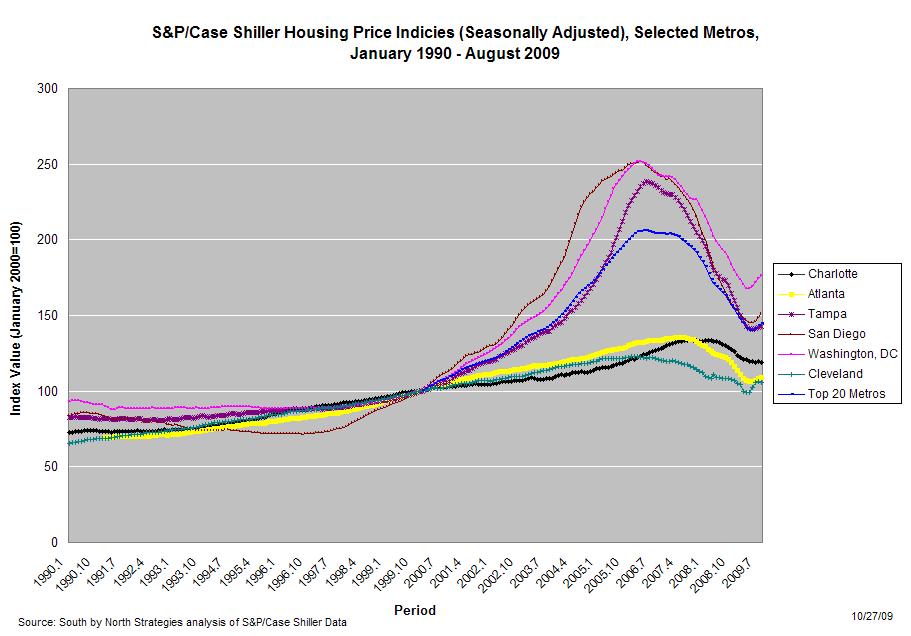