

Gauging Success In Workforce Development
Issues related to performance measurement long have bedeviled federal workforce development programs. The challenges associated with gauging success have only grown more pronounced during the “Great Recession,” a time when jobs have proven scarce. What is an acceptable workforce development outcome during a “jobless” recovery? Which metrics are appropriate for gauging a program’s performance? What are reasonable benchmarks to use?
To help answer such questions, the North Carolina Rural Economic Development Center commissioned South by North Strategies, Ltd. in 2011 to document changes in local labor markets during the Great Recession, scan how other jurisdictions have used supplemental federal workforce funding extended under the American Recovery and Reinvestment Act, and interpret outcome data from demonstration workforce development projects in light of local economic conditions and the performance of area workforce development programs serving adult and dislocated workers.
The resulting report served as a companion to a formal evaluation of the Rural Community Mobilization Project, a statewide initiative coordinated by the Rural Center that used federal Recovery Act funds to support local projects striving to address the economic problems of rural communities and assist unemployed and underemployed rural residents.
Around The Dial – February 16, 2012
Economic policy reports, blog postings, and media stories of interest:
- Jonathan Cohn points out that “budgets are about priorities.”
- Nouriel Roubini runs down risks facing the global economy.
- Mark Thoma asks if “distribution of money is fair.”
- Off the Charts runs down arguments for taxing services.
NC Unemployment Claims: Week Of 1/28/12
For the benefit week ending on January 28, 2012, some 13,562 North Carolinians filed initial claims for state unemployment insurance benefits, and 124,781 individuals applied for state-funded continuing benefits. Compared to the prior week, there were fewer initial and continuing claims. These figures come from data released by the U.S. Department of Labor.
Averaging new and continuing claims over a four-week period — a process that helps adjust for seasonal fluctuations and better illustrates trends — shows that an average of 14,483 initial claims were filed over the previous four weeks, along with an average of 126,586 continuing claims. Compared to the previous four-week period, the average number of initial claims was lower, as was the average number of continuing claims.
One year ago, the four-week average for initial claims stood at 17,862, and the four-week average of continuing claims equaled 141,030.
In recent weeks covered employment has increased and now slightly exceeds the level recorded a year ago (3.74 million versus 3.71 million). Nevertheless, there are still fewer covered workers than there were in January 2008, which means that payrolls are smaller today than they were four years ago.
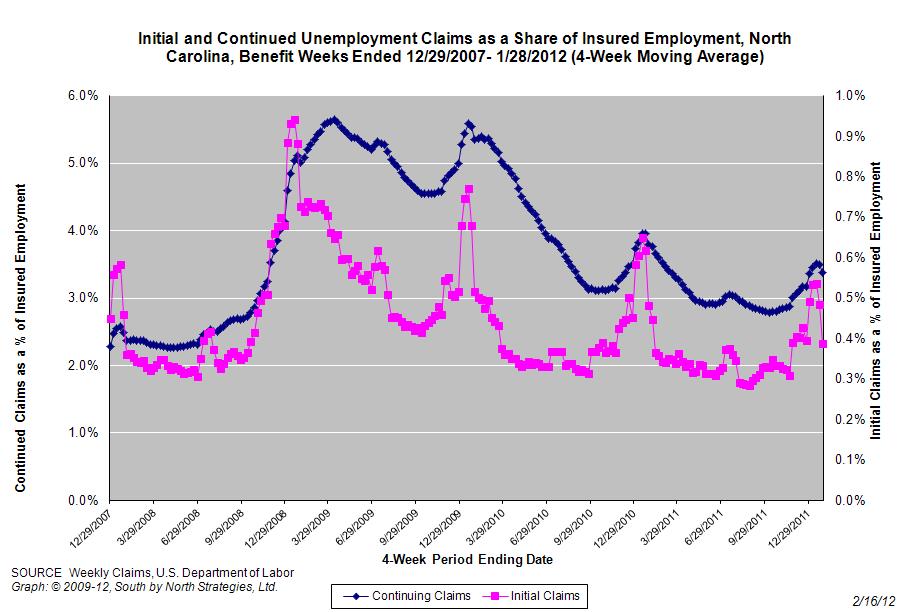
The graph shows the changes in unemployment insurance claims measured as a share of covered employment in North Carolina since the recession’s start in December 2007.
Both new and continuing claims appear to have peaked for this cycle, and the four-week averages of new and continuing claims have fallen considerably. Yet continuing claims remain at an elevated level, which suggests that unemployed individuals are finding it difficult to find new positions.
Around The Dial – February 14, 2012
Economic policy reports, blog postings, and media stories of interest:
- Laura D’Andrea Tyson argues “why manufacturing still matters.”
- AlterNet provides more details on Apple’s dealings in China.
- Chad Stone notes that safety net spending should rise during downturns.
- James Kwak runs down the case, pro and con, for taxing investment differently.
- David Frum doesn’t buy Charles Murray’s arguments about the white-working class.
Is Work A Move Away?
Jack Temple of Policy Shop mulls the “spatial mismatch” theory of unemployment and finds it wanting.
While the spatial mismatch theory was actually introduced in the 1960s to explain the role that residential segregation plays in fueling unemployment for black households, it’s gotten renewed attention as of late given the role that the housing downturn has played in the recession. The story goes like this: 1) Some 16 million households have negative equity in their homes, 2) these households are likely clustered in areas that are suffering from a more general economic downturn, 3) having an underwater mortgage makes it difficult for people to move to areas with stronger job growth, and 4) mismatch ensues.
…
Sounds logical — but, according to a report released on Wednesday from the Federal Reserve Bank of Boston, the spatial mismatch theory just doesn’t shake out. The Fed report modeled the role that negative equity itself plays in household migration decisions and then estimated the impact of improved mobility for underwater households on the national unemployment rate.
…
The results are pretty clear. Overall, negative equity reduced inter-state relocation (the type of relocation most like to occur for employment purposes) by a grand total of 0.05 percent from 2006 to 2009…. If this reduction hadn’t occured, and all of these people not only moved but also found a job in their new location, it would have yielded an unemployment rate in 2009 of 9.0 percent as opposed to 9.3 percent.
 Email Sign-Up
 RSS Feed