

Concentrated Poverty In America’s Metros
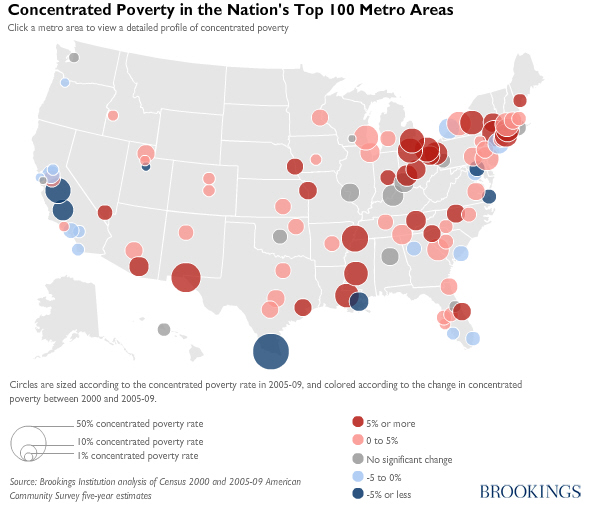
The Brookings Institution maps the increases in poverty that occurred in the United States between 2000 and 2010, paying special attention to significant concentrations in poverty in the nation’s most populous metro areas.
Imagining A “Good” Jobs Report
Rortybomb describes what a “good” national employment report would look like.
First of all, there would have been job growth that gets us back to full employment instead of job growth that is slightly around the rate of population growth. There would be well over 150,000 jobs created a month, ideally above 200,000 and even beyond that — there’s a lot of catching up to do. The key indicator to watch is the employment-population ratio, which is the percentage of the workforce that has a job. As unemployment only indicates the number of people actively searching for a job, and many are dropping out of the labor force and giving up on finding a job, the unemployment rate tells us less and less. And if the population is growing faster than the number of jobs created, we are losing out. The employment-population ratio tells us the actual rate at which we are employing people. It is currently at 58.4 percent, the same it was in January 2011.
Around The Dial – November 7, 2011
Economic policy reports, blog postings, and media stories of interest:
- Rortybomb depicts changes in income inequality.
- Off the Charts pictures the latest national employment report.
- Econbrowser explains trends in auto and housing sales.
- Martin Wolf points out that creditors and debtors go together.
- Economix describes “the lasting financial impact of a layoff.”
The Benefits Of Public Transit
A recent BTC Brief from the NC Budget and Tax Center explains why policymakers should not lose sight of equity concerns when investing in public transit.
Last year, North Carolinians traveling to work by means of public transit were disproportionately people with lower incomes: 60.4 percent of riders had incomes below $25,000 while only 13 percent had incomes above $50,000. Transit-oriented development is a planning approach that can benefit lower-income people by increasing access to employment networks and services, reducing transportation expenditures, and renewing private investment in economically depressed areas. However, transit investments can lead to higher rent prices, gentrification, and displacement of lower-income residents around new transit stations.
…
To ensure that transit investments generate a return for all North Carolinians, evidence suggests that transit plans need equity components—primarily, affordable housing measures.
Flat Tax Fantasies
Writing in The New York Times, economist Robert Frank of Cornell University explains “the problem with flat tax fever.”
The much more serious concern is that a flat tax would reinforce the trends toward greater income inequality that have been seen over the last several decades. As documented by a recent Congressional Budget Office study, the top 1 percent of income recipients in the United States earned 275 percent more in 2007 than they did in 1979, adjusted for inflation, a period when the earnings of middle-income households grew by less than 40 percent. A flat tax would increase inequality by substantially reducing rates on the most prosperous households, while increasing them on low- and middle-income households.
…
According to an analysis by the nonpartisan Tax Policy Center, Mr. Cain’s proposal would increase the annual tax bill of a typical family of four earning $50,000 a year by more than $4,000, but would reduce the taxes owed by a similar family earning between $500,000 and $1 million by almost $60,000. The center also estimated that families in the top one-tenth of 1 percent of households would enjoy an average annual tax reduction of nearly $1.4 million under the Cain plan. Similar distributional effects are common under all flat-tax plans, not just Mr. Cain’s.
 Email Sign-Up
 RSS Feed