

N.C.’s “Big 15” Counties For Voter Turnout
The latest issue of North Carolina DataNet, a publication of the UNC Program on Public Life, analyzes voter turnout data from recent elections and explains how the “metropolitanization” of North Carolina is altering the state’s politics. In 2008, for instance, 15 metropolitan counties accounted for 53 percent of all the votes cast in that year’s general election.
Among other findings, the report documented an ongoing shift in the sources of partisan support …
The 2010 elections have highlighted an emerging trend, potentially another shift away from long-standing North Carolina patterns. The Republican Party has picked up rural and nonmetro legislative seats that used to serve as bastions of Democratic legislative strength. Yes, Republicans maintain a strong presence in metro areas, especially suburbs and exurbs, but the GOP now has more of a non-metro tilt than the Democrats.
…
The center of gravity in the Democratic Party, meanwhile, now appears in the core counties of the state’s major metro areas. The Democratic legislative minority has a more of a metro than a rural tilt.
Around The Dial – August 18, 2011
Economic policy reports, blog postings, and media stories of interest:
- Naked Capitalism updates its BofA “death watch.”
- Off the Charts explains how the debt deal will impact states, localities.
- Mark Thoma thinks about ways of balancing the federal budget.
- McClatchy News Service reports on unemployment’s mental toll.
- David Sirota doesn’t buy “the innocent bystander fable” about politics.
NC Unemployment Claims: Week of 7/30/11
For the benefit week ending on July 30th, 11,168 North Carolinians filed initial claims for state unemployment insurance benefits, and 109,265 individuals applied for state-funded continuing benefits. Compared to the prior week, there were more initial and fewer continuing claims. These figures come from data released by the U.S. Department of Labor.
Averaging new and continuing claims over a four-week period — a process that helps adjust for seasonal fluctuations and better illustrates trends — shows that an average of 12,868 initial claims were filed over the previous four weeks, along with an average of 112,554 continuing claims. Compared to the previous four-week period, the averages of initial and continuing claims were lower.
One year ago, the four-week average for initial claims stood at 13,853 and the four-week average of continuing claims equaled 140,019.
While the number of claims has dropped over the past year so has covered employment. Last week, covered employment totaled 3.7 million, down from 3.8 million a year ago.
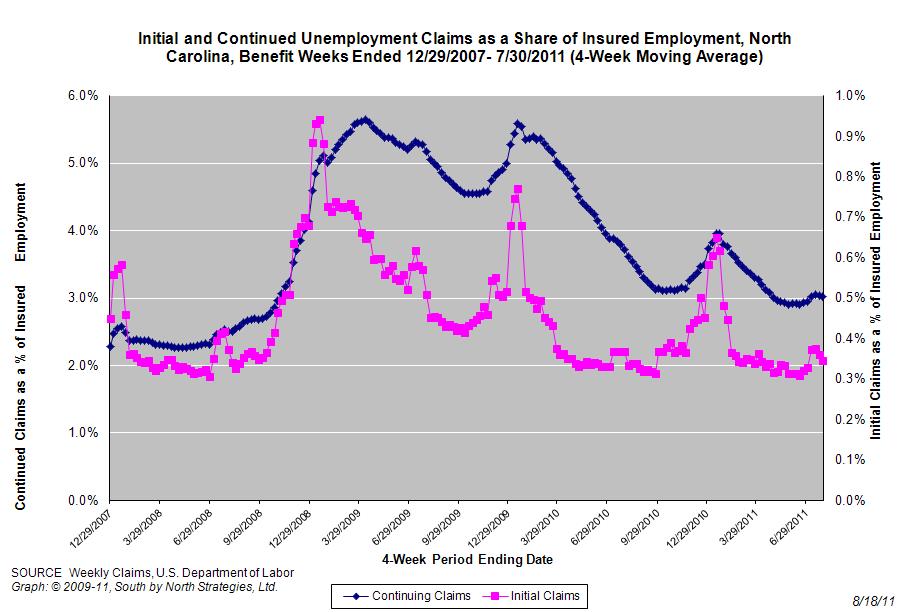 The graph shows the changes in unemployment insurance claims (as a share of covered employment) in North Carolina since the recession’s start in December 2007.
Both new and continuing claims appear to have peaked for this cycle, and the four-week averages of new and continuing claims have fallen considerably. Yet continuing claims remain at an elevated level, which suggests that unemployed individuals are finding it difficult to find new positions.
Making Ends Meet In North Carolina
From the latest edition of the North Carolina Living Standard calculated by the N.C. Budget and Tax Center …
This 2010 version of the Living Income Standard finds that the North Carolina family of two adults and two children must earn $48,814 annually—an amount equal to 221 percent of the federal poverty level—to afford the actual costs of seven essential expenses: housing, food, childcare, health care, transportation, taxes and other necessities (like clothing, personal care items, household supplies, school supplies and local telephone service). To meet that level, the adults in the average four-person family would need to earn a combined $23.47 per hour and work 40 hours a week, 52 weeks a year.
From the report’s policy recommendations …
But public policy can and should do more than subsidize low-wage work. Public policy should support the creation of quality jobs that meet, at a minimum, the living income standard and provide benefits such as retirement savings and health insurance. State policymakers should set wage and benefit standards at the living income standard and require businesses to meet these standards if they seek to access taxpayer dollars through economic development subsidies.
Around The Dial – August 17, 2011
Economic policy reports, blog postings, and media stories of interest:
- Warren Buffet thinks it’s time to “stop coddling the super-rich.”
- Yves Smith doesn’t buy the “business needs certainty” argument.
- Rortybomb thinks about the logic of unemployment insurance.
- Joe Nocera wonders what businesses are waiting for.
- Jared Bernstein summarizes key facts about Social Security.
 Email Sign-Up
 RSS Feed