Policy Points
11.05.2015
Our Projects, Policy Points
 In 2015, South by North Strategies, Ltd. prepared an analysis of issues related to income security for older North Carolinians. Specifically, the study explores retirement income issues related to the adequacy of private household savings and the soundness of various public-sector pension plans.
The research was part of a larger study of state-level aging issues undertaken by the North Carolina Center for Public Policy Research. The complete project was published in early 2015 under the title “Serving Our Seniors.”
22.04.2015
News Releases, Policy Points
RALEIGH, NC (April 22, 2015) – A
new report released today finds that the income of the typical North Carolina household fell not just during the “Great Recession,” but has continued to fall during the recovery, leaving the proclamations of a “Carolina Comeback” far short of the mark. The report was written by John Quinterno of South by North Strategies, Ltd. on behalf of Think NC First.Among the
report’s key findings are the following:
- From 2007 to 2013, the inflation-adjusted income of the median North Carolina household dropped by more than 8%. Median income fell by 5.5% from 2007 to 2009 and by another 3.2% during the recovery that started in 2009 through 2013.
- From 2009 to 2013, real average household income fell or remained unchanged for every household income group in North Carolina except for the top 5%.
- The distribution of household income in North Carolina has grown more unequal since 2007, and the distribution of income in North Carolina in 2013 was more unequal than in the nation as a whole.
- The annual earnings of the median worker (ages 16+) fell by 7.4% between 2007 and 2013.
- Median annual earnings have fallen regardless of a worker’s level of education (ages 25+). Even typical workers with bachelor’s degrees or postgraduate degrees saw their earnings drop from 2007 to 2013.
- Real median household income in North Carolina was effectively no different in 2013 than in 1984.
“Since peaking in early 2010, North Carolina’s unemployment rate has fallen sharply, a development that has led many civic leaders and pundits to herald a ‘Carolina Comeback.’ That claim, while alliterative, glosses over the deep problems that still trouble the state’s labor market and ignores the erosion in household income levels and living standards that have occurred since the last recession,” writes John Quinterno. “Judged against the criteria of broadly rising incomes and living standards, North Carolina’s comeback is far short of the mark.”
Click here to access the full report.For questions about the report, interviews and other media requests please contact John Quinterno at johnq@sbnstrategies.com or (919) 622-2392.
####
Think North Carolina First (Think) is a policy and message development think tank that serves as a reliable source of evidence-based research for policy makers and thought leaders. It is Think’s mission to produce pragmatic ideas and research accessible to the average North Carolinian that can be used to formulate, debate and implement public policy.
South by North Strategies, Ltd. is a research and communications firm specializing in economic and social policy. It provides applied policy research for organizations seeking to understand and address economic and social issues. The firm is based in Chapel Hill, North Carolina.
21.04.2015
News Releases, Policy Points
CHAPEL HILL, NC (April 21, 2015) – In March, employers in North Carolina cut 2,600 more jobs than they added, with net reductions occurring in the private and public sectors. Over the year, however, North Carolina gained 113,700 more jobs than it lost, due entirely to gains in the private sector. Although the statewide unemployment rate rose to 5.4 percent in March, the rate still was a full percentage point lower than had been the case a year earlier.
These findings come from new data released today by the Labor and Economic Analysis Division of the NC Department of Commerce.
“The first quarter of 2015 proved to be a relatively uneventful one for job growth in North Carolina,” said John Quinterno, a principal with South by North Strategies, Ltd., a research firm specializing in economic and social policy. “So far this year, the state has gained 16,500 more payroll jobs than it has lost. For comparison, the corresponding number in 2014 was a gain of 13,000 jobs. Yet even with the gains, however, North Carolina has just 51,600 more jobs, or 1.2 percent more jobs, than it did over seven years earlier.”
Between February 2015 and March 2015, North Carolina employers cut 2,600 more jobs than they added (-0.1 percent). Private-sector payrolls lost, on net, 1,500 positions (-0.1 percent), and public-sector payrolls lost, on net, 1,100 jobs (-0.2 percent). Within private industry, the construction sector shed the most jobs (-2,400, -1.3 percent), while the professional and business services sector netted the most jobs (+2,700, +0.5 percent, with 55.6 percent of the gain occurring in the administrative and waste management services subsector). Overall, payroll levels fell in six major private industrial sectors, rose in three, and were unchanged in one.
A revision to the February payroll data found that the state gained more jobs than first reported (+17,500 jobs versus an original estimate of +16,800 jobs). With that revision, North Carolina now has, on net, 51,600 more payroll positions (+1.2 percent) than it did in December 2007. Since bottoming out in February 2010, the state’s labor market has netted an average of 6,200 payroll jobs per month, resulting in a cumulative gain of 378,400 positions (+9.9 percent).
Over the year, North Carolina employers added 113,700 more jobs than they cut (+2.8 percent). Private-sector payrolls gained, on net, 117,300 positions (+3.5 percent), while public-sector payrolls lost, on net, 3,600 jobs (-0.5 percent). Within private industry, virtually every major industrial sector netted payroll jobs, with the professional and business services sector gaining the most positions (+32,900, +5.9 percent, with 64 percent of the gain occurring in the administrative and waste management services subsector).
“The steady payroll growth experienced over the past year remains insufficient to close the job gap that exists in North Carolina,” noted Quinterno. “The fact that North Carolina now has slightly more jobs than it did when the recession started should not be taken to mean that the state’s labor market has recovered fully.”
According to the monthly household data, the statewide unemployment rate rose in March to 5.4 percent, which remains close to the lowest rate logged since early 2008. Last month’s rise in the unemployment rate was attributable in large part to an increase in the size of the labor force (+31,938 persons, +0.7 percent). Over the month, the number of employed North Carolinians increased by 26,012 persons (+0.6 percent), and the number of unemployed persons rose by 5,926 individuals (+2.4 percent).
Over the past year, the statewide unemployment rate fell by a full percentage point, dropping to 5.4 percent from 6.4 percent, with the number of unemployed North Carolinians decreasing by 44,460 persons (-14.9 percent). During that same period, the number of employed persons rose by 118,628 individuals (+2.7 percent), while the size of the labor force increased by 74,168 persons (+1.6 percent). This suggests that the labor market managed to accommodate new members of the labor force and move unemployed persons into jobs.
Other improvements recorded over the course of the year include a rise in the share of working-age North Carolinians participating in the labor market (to 60.7 percent from 60.5 percent) and the share of working-age North Carolinians who are employed (to 57.5 percent from 56.6 percent). Nevertheless, both of these measures remain near the lowest monthly rates recorded at any time since January 1976.
Between March 2014 and March 2015, the number of claimants of regular state-funded insurance fell by 36.7 percent, dropping to 33,359 from 52,666. Also in March 2015, the state paid a (nominal) total of $29.5 million in regular state-funded unemployment insurance compensation, an amount 40.3 percent lower than the (nominal) total of $49.4 million paid in March 2014.
“North Carolina’s labor market recorded a number of positive improvements over the past year, but those gains must not be taken as signs that the labor market has mended itself,” said Quinterno. “Over five years into a recovery, North Carolina still faces a sizable jobs gap largely because the labor market simply is not generating enough jobs, fast enough to accommodate all those who want and need work.”
16.04.2015
Policy Points
For the benefit week ending on March 28, 2015, North Carolinians filed some 3,791 initial claims for state unemployment insurance benefits and 35,573 claims for state-funded continuing benefits. Compared to the prior week, there were fewer initial claims and fewer continuing claims. These figures come from data released by the US Department of Labor.
Averaging new and continuing claims over a four-week period — a process that helps adjust for seasonal fluctuations and better illustrates trends — shows that an average of 4,155 initial claims were filed over the previous four weeks, along with an average of 37,394 continuing claims. Compared to the previous four-week period, the average number of initial claims was lower, and the average number of continuing claims was lower.
One year ago, the four-week average for initial claims stood at 5,000, and the four-week average of continuing claims equaled 62,840.
In recent months covered employment has increased and now exceeds the level recorded a year ago (3.94 million versus 3.87 million). Nevertheless, there are still fewer covered workers than there were in January 2008, which means that payrolls are smaller today than they were more than seven years ago.
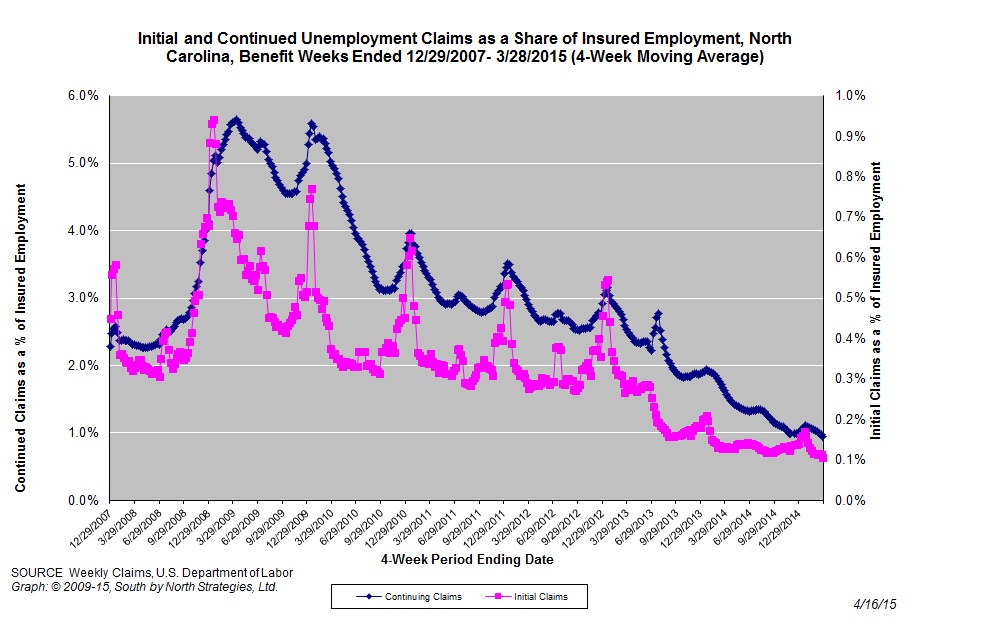
The graph (below right) shows the changes in unemployment insurance claims measured as a share of covered employment in North Carolina since the recession’s start in December 2007.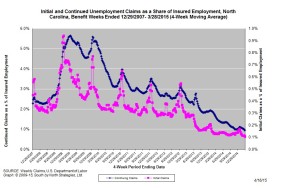
Both new and continuing claims have peaked for this cycle, and the four-week averages of new and continuing claims have fallen considerably. The four-week average of initial claims, when measured as a share of covered employment, is at the lowest level recorded since early 2008, while the four-week average of continuing claims is at the lowest level recorded since early 2008.
Note that the recent year-over-year declines in new and continuing claims are not necessarily indicative of an improving labor market. State legislation that took effect on July 1, 2013, made major changes to insurance eligibility criteria, and the more stringent criteria eliminate claims that would have been valid prior to July 1, 2013. Additionally, the legislation reduced the maximum number of weeks of state-funded insurance for which a claimant is eligible — an action that reduces the number of continuing claims.
To place the numbers in context, consider how the four-week average of initial claims (4,155) was 16.5 percent lower than the figure recorded one year ago (5,000), while the average number of continuing claims was 40.5 percent lower (37,394 versus 62,840). Given the modest rate of job growth that has occurred in North Carolina over the past year, such declines likely are, at least in part, products of changes to unemployment insurance laws rather than improvements in underlying economic conditions.
09.04.2015
Policy Points
For the benefit week ending on March 21, 2015, North Carolinians filed some 4,149 initial claims for state unemployment insurance benefits and 37,029 claims for state-funded continuing benefits. Compared to the prior week, there were fewer initial claims and fewer continuing claims. These figures come from data released by the US Department of Labor.
Averaging new and continuing claims over a four-week period — a process that helps adjust for seasonal fluctuations and better illustrates trends — shows that an average of 4,499 initial claims were filed over the previous four weeks, along with an average of 38,677 continuing claims. Compared to the previous four-week period, the average number of initial claims was lower, and the average number of continuing claims was lower.
One year ago, the four-week average for initial claims stood at 4,972, and the four-week average of continuing claims equaled 64,499.
In recent months covered employment has increased and now exceeds the level recorded a year ago (3.94 million versus 3.87 million). Nevertheless, there are still fewer covered workers than there were in January 2008, which means that payrolls are smaller today than they were more than seven years ago.
The graph (below right) shows the changes in unemployment insurance claims measured as a share of covered employment in North Carolina since the recession’s start in December 2007.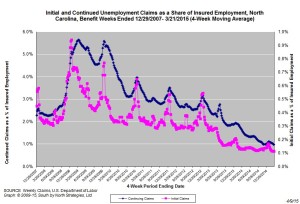
Both new and continuing claims have peaked for this cycle, and the four-week averages of new and continuing claims have fallen considerably. The four-week average of initial claims, when measured as a share of covered employment, is at the lowest level recorded since early 2008, while the four-week average of continuing claims is at the lowest level recorded since early 2008.
Note that the recent year-over-year declines in new and continuing claims are not necessarily indicative of an improving labor market. State legislation that took effect on July 1, 2013, made major changes to insurance eligibility criteria, and the more stringent criteria eliminate claims that would have been valid prior to July 1, 2013. Additionally, the legislation reduced the maximum number of weeks of state-funded insurance for which a claimant is eligible — an action that reduces the number of continuing claims.
To place the numbers in context, consider how the four-week average of initial claims (4,499) was 9.5 percent lower than the figure recorded one year ago (4,972), while the average number of continuing claims was 40.8 percent lower (38,677 versus 64,499). Given the modest rate of job growth that has occurred in North Carolina over the past year, such declines likely are, at least in part, products of changes to unemployment insurance laws rather than improvements in underlying economic conditions.


 Email Sign-Up