Policy Points
05.12.2014
News Releases, Policy Points
CHAPEL HILL, NC (December 5, 2014) – In November, the national labor market added 321,000 more jobs than it lost due primarily to gains in the private sector. Also in November, the unemployment rate held steady at 5.8 percent. While numerous labor market conditions have improved over the past year, joblessness remains a problem in the United States.
“November was the 50th-straight month in which the United States experienced net job growth,” said John Quinterno, a principal with South by North Strategies, Ltd., a research firm specializing in economic and social policy. “Over the year, the economy netted an average of 228,000 jobs per month, a pace that reduced—but did not fully repair—the damage inflicted on the national labor market during the last recession.”
In November, the nation’s employers added 321,000 more payroll jobs than they cut. Some 98 percent of the gain originated in the private sector (+314,000), while public employers added 7,000 more positions than they cut. Within the private sector, payroll levels increased the most in the professional and business services sector (+86,000, with 48.5 percent of the gain occurring in the administrative and waste services subsector), followed by the trade, transportation, and utilities sector (+71,000, with 70.7 percent of the gain originating in the retail trade subsector) and the education and health services sector (+38,000, with 76.1 percent of the gain originating in the health care subsector.
Payroll levels in all other major industry groups either rose in November or were unchanged from the October levels.
Additionally, the payroll employment numbers for September and October underwent revisions; with the updates, the economy netted 514,000 jobs over those two months, not the 470,000 positions previously reported. With those changes, the average pace of monthly job growth in the United States recorded over the past year rose to 228,000.
“The United States has experienced steady job growth for over four years, but the pace of growth has been modest relative to the country’s needs,” noted Quinterno. “While the United States has more payroll jobs than it did in December 2007, the current average monthly rate of job growth is insufficient to close the jobs gap caused by the recession—a gap now estimated at a little under 6 million jobs—anytime soon.”
Data from the household survey offered mixed news about the health of the United States’ labor market. In November, the number of Americans who were employed was essentially no different than it was in October. At the same time, the overall size of the labor force rose by 119,000 persons (+0.1 percent) between October and November. Meanwhile, the share of working-age Americans participating in the labor force held steady in November, as did the share of working-age Americans with a job.
In November, 9.1 million Americans were unemployed (5.8 percent), while 6.9 million individuals worked part time despite preferring full-time positions. Another 698,000 individuals (not seasonally adjusted) were so discouraged about their job prospects that they had stopped searching for work altogether. Those persons were part of a larger population of 2.1 million Americans who were marginally attached to the labor force.
Compared to a year ago, 2.8 million more Americans were working in November, and 1.7 million fewer persons were unemployed. At the same time, the share of the working-age population with a job (59.2 percent) remained at a depressed level, while the share of the population that was participating in the labor force fell to 62.8 percent from 63 percent.
Last month, the unemployment rate was higher for adult male workers than adult female workers (5.4 percent versus 5.3 percent). Unemployment rates were higher among Black (11.1 percent) and Hispanic workers (6.6 percent) than among white ones (4.9 percent). The unemployment rate among teenagers was 17.7 percent.
Additionally, 4.5 percent of all veterans were unemployed in November, and the rate among recent veterans (served after September 2001) was 5.7 percent. At the same time, 10.8 percent of Americans with disabilities were jobless and seeking work (not seasonally adjusted).
Jobs remained comparatively hard to find in November. Last month, the underemployment rate equaled 11.4 percent, down from the 13.1 percent rate logged a year ago. Among unemployed workers, 30.7 percent had been jobless for at least six months, as opposed to 37.4 percent a year earlier. And the average spell of unemployment equaled 33 weeks, down from 37.1 weeks in November 2013.
In November, the leading cause of unemployment remained a job loss or the completion of a temporary job, which was the reason cited by 49 percent of unemployed persons. Another 30.3 percent of unemployed persons were re-entrants to the labor market, while 11.6 percent were new entrants. Voluntary job leavers accounted for the remaining 9.1 percent of the total.
“The November employment report offered a portrait of a national job market that is improving yet remains far from healed,” observed Quinterno. “Weak growth, in turn, is preventing American workers from experiencing improvements in their wages and living standards despite the fact that they have become more economically productive.”
04.12.2014
Policy Points
For the benefit week ending on November 15, 2014, North Carolinians filed some 5,557 initial claims for state unemployment insurance benefits and 39,504 claims for state-funded continuing benefits. Compared to the prior week, there were more initial claims and more continuing claims. These figures come from data released by the US Department of Labor.
Averaging new and continuing claims over a four-week period — a process that helps adjust for seasonal fluctuations and better illustrates trends — shows that an average of 5,219 initial claims were filed over the previous four weeks, along with an average of 40,496 continuing claims. Compared to the previous four-week period, the average number of initial claims was higher, and the average number of continuing claims was lower.
One year ago, the four-week average for initial claims stood at 6,772, and the four-week average of continuing claims equaled 70,962.
In recent months covered employment has increased and now exceeds the level recorded a year ago (3.92 million versus 3.86 million). Nevertheless, there are still fewer covered workers than there were in January 2008, which means that payrolls are smaller today than they were almost 7 years ago.
The graph (below right) shows the changes in unemployment insurance claims measured as a share of covered employment in North Carolina since the recession’s start in December 2007.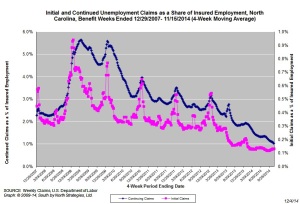
Both new and continuing claims have peaked for this cycle, and the four-week averages of new and continuing claims have fallen considerably. The four-week average of initial claims, when measured as a share of covered employment, is near the lowest level recorded since early 2008, while the four-week average of continuing claims is at the lowest level recorded since early 2008.
Note that the recent year-over-year declines in new and continuing claims are not necessarily indicative of an improving labor market. State legislation that took effect on July 1, 2013, made major changes to insurance eligibility criteria, and the more stringent criteria eliminate claims that would have been valid prior to July 1, 2013. Additionally, the legislation reduced the maximum number of weeks of state-funded insurance for which a claimant is eligible — an action that reduces the number of continuing claims.
To place the numbers in context, consider how the four-week average of initial claims (5,219) was 22.9 percent lower than the figure recorded one year ago (6,772), while the average number of continuing claims was 42.9 percent lower (40,496 versus 70,962). Given the modest rate of job growth that has occurred in North Carolina over the past year, such large declines likely are products of changes to unemployment insurance laws rather than improvements in underlying economic conditions.
21.11.2014
News Releases, Policy Points
CHAPEL HILL, NC (November 21, 2014) – In October, employers in North Carolina added 17,200 more payroll jobs than they cut (+0.4 percent), due mainly to hiring in the private sector. The monthly household survey, meanwhile, logged a drop in the unemployment rate to 6.3 percent. With last month’s net job growth, North Carolina now has slightly more jobs than it did in December 2007, yet the state also has 28.4 percent more unemployed residents than it did almost seven years ago, as well as an unemployment rate that is 1.3 percentage points higher.
These findings come from new data released today by the Labor and Economic Analysis Division of the NC Department of Commerce.
“The October employment report was consistent with the pattern of modest jobs growth that has characterized North Carolina’s slow recovery from the last recession,” said John Quinterno, a principal with South by North Strategies, Ltd., a research firm specializing in economic and social policy. “North Carolina netted jobs in October and now has slightly more jobs than it did in December 2007, but that is not the same thing as a full labor market recovery.”
Between September 2014 and October 2014, North Carolina employers added 17,200 more jobs than they cut (+0.4 percent). Private-sector payrolls netted 13,700 positions (+0.4 percent), and public-sector payrolls netted 3,500 jobs (+0.5 percent), owing primarily to hiring by local governments (+7,500, +1.7 percent). Within private industry, the education and health services sector netted the most jobs (+6,100, +1.1 percent), with all of the hiring originating in the health care and social services subsector. The leisure and hospitality sector netted 3,500 jobs (+0.8 percent, with 77.1 percent of the gain originating in the accommodation and food service subsector), followed by the other services sector (+2,300, +1.5 percent). Meanwhile, the finance sector shed the most jobs (-2,000 jobs, -0.9 percent). All other major industrial sectors experienced modest changes in payroll sizes.
A revision to the September 2014 payroll data found that the state gained 3,300 fewer jobs that month than first estimated (+10,700 versus +14,000). With the revision, North Carolina now has, on net, slightly more payroll jobs (+15,900, +0.4 percent) than it did in December 2007, which is when the “Great Recession” began nationally. Since bottoming out in February 2010, the state has netted an average of 6,155 payroll jobs per month, resulting in a cumulative gain of 344,700 positions (+9 percent).
Note that the return of North Carolina’s payroll size to the pre-recession level does not mean that the state’s labor market has recovered. Over the past 6.75 years, North Carolina has needed not only to replace the jobs lost during the recession, but also to add jobs to keep pace with the growth of the working-age population. By one estimate, North Carolina still is 441,000 payroll jobs short of the number it should have added since late 2007 to accommodate the 11 percent rate of population growth that has occurred since then. At the current pace of net job growth, it would take another 72 months to fill that gap, holding all else equal.
“Although North Carolina has experienced job growth in 2014, the pace of growth has been modest,” noted Quinterno. “Over the first 10 months of the year, payroll employment in North Carolina expanded by 1.9 percent. The comparable rate in 2013 was 2 percent, and in 2012, the comparable rate was 1.6 percent. These rates are consistent with a sluggish recovery.”
In contrast to the payroll data, the household data recorded October pointed to a labor market that has yet to recover the ground lost during the recession. Last month, the statewide unemployment rate dipped to 6.3 percent from 6.7 percent, while the number of unemployed individuals fell by 16,685 (-5.4 percent). At the same time, the number of employed North Carolinians rose (+17,508, +0.4 percent). And the size of the labor force essentially held steady at 4.6 million persons.
Over the year, the statewide unemployment rate fell by 1.2 percentage points, dropping to 6.7 percent from 7.5 percent, with the number of unemployed North Carolinians decreasing by 54,551 persons (-15.7 percent). However, 47.8 percent of the decline was attributable to people who left the labor force entirely rather than to those who became employed. If those 26,104 leavers from the labor force were added back and considered unemployed, the statewide unemployment rate in October would have equaled 6.8 percent. Even if 50 percent of those individuals were added back to the labor force and considered unemployed, the statewide unemployment rate would have equaled 6.6 percent.
Year-over-year declines in the statewide labor force participation rate provide additional evidence of a labor market with problematic underlying dynamics. In October, the share of working-age North Carolinians participating in the labor market was 60.3 percent, which was lower than the 61.3 percent figure logged a year ago and was tied for the lowest monthly rate recorded at any time since January 1976.
In addition, another important measure of labor utilization, the employment-to-population ratio, fell over the year, dropping to 56.5 percent from 56.8 percent. The current share of working-age North Carolinians with a job is just slightly above the lowest rate logged at any point since 1976.
The October labor market report provides additional insight into the effects of the extensive changes to the state’s system of unemployment insurance implemented in July 2013. Between September and October, the number of claimants of regular state-funded insurance fell by 10.3 percent, dropping to 33,283 from 37,107. Compared to a year earlier, 27,842 fewer individuals received regular state-funded insurance in October (-45.5 percent).
Also in October, the state paid a (nominal) total of $27.9 million in regular state-funded unemployment insurance compensation, an amount 53.7 percent lower than the (nominal) total of $60.2 million paid in October 2013.
“North Carolina netted jobs in October, but even with those gains, the state simply is not adding jobs at a rapid enough pace to keep pace with the growth in the working-age population, and that is why joblessness remains a problem across much of the state,” added Quinterno. “While the state now has the same number of jobs as it did when the last recession started, that development does not signal a full labor market recovery. On the contrary, weak job growth and joblessness remain significant problems.”
20.11.2014
Policy Points
For the benefit week ending on November 1, 2014, North Carolinians filed some 5,702 initial claims for state unemployment insurance benefits and 41,189 claims for state-funded continuing benefits. Compared to the prior week, there were more initial claims and fewer continuing claims. These figures come from data released by the US Department of Labor.
Averaging new and continuing claims over a four-week period — a process that helps adjust for seasonal fluctuations and better illustrates trends — shows that an average of 5,178 initial claims were filed over the previous four weeks, along with an average of 42,708 continuing claims. Compared to the previous four-week period, the average number of initial claims was higher, and the average number of continuing claims was lower.
One year ago, the four-week average for initial claims stood at 6,573, and the four-week average of continuing claims equaled 70,488.
In recent months covered employment has increased and now exceeds the level recorded a year ago (3.92 million versus 3.85 million). Nevertheless, there are still fewer covered workers than there were in January 2008, which means that payrolls are smaller today than they were more than 6.5 years ago.
The graph (below right) shows the changes in unemployment insurance claims measured as a share of covered employment in North Carolina since the recession’s start in December 2007.
Both new and continuing claims have peaked for this cycle, and the four-week averages of new and continuing claims have fallen considerably. The four-week average of initial claims, when measured as a share of covered employment, is near the lowest level recorded since early 2008, while the four-week average of continuing claims is at the lowest level recorded since early 2008.
Note that the recent year-over-year declines in new and continuing claims are not necessarily indicative of an improving labor market. State legislation that took effect on July 1, 2013, made major changes to insurance eligibility criteria, and the more stringent criteria eliminate claims that would have been valid prior to July 1, 2013. Additionally, the legislation reduced the maximum number of weeks of state-funded insurance for which a claimant is eligible — an action that reduces the number of continuing claims.
To place the numbers in context, consider how the four-week average of initial claims (5,043) was 19.2 percent lower than the figure recorded one year ago (6,238), while the average number of continuing claims was 38.3 percent lower (43,613 versus 70,675). Given the modest rate of job growth that has occurred in North Carolina over the past year, such large declines likely are products of changes to unemployment insurance laws rather than improvements in underlying economic conditions.
06.11.2014
Our Projects, Policy Points
In the summer of 2014, South by North Strategies, Ltd. prepared an overview of the impact of The Working Poor Families Project (WPFP), a national initiative to assess and strengthen state efforts to help low–income families advance and achieve economic security. To that end, the WPFP partners with nonprofit organizations in 22 states and the District of Columbia.
Among other findings, the project estimated that the WPFP and its state partners have generated or protected approximately $7.6 billion in state investments on behalf of low-income working families since 2002. These investments have occurred in the broad areas of postsecondary education and skills training; economic development; and social insurance and family benefits, with the bulk of the investments occurring in the area of postsecondary education and skills training.


 Email Sign-Up