19.01.2010
Policy Points
Economic policy reports, blog postings, and media stories of interest:
19.01.2010
Policy Points
On January 29th, the U.S. Bureau of Economic Analysis will release its advance estimate of the Gross Domestic Product during the fourth quarter of 2009. The estimate, which will be subject to two revisions, will feature prominently in assessments of the national economy’s health and debates over the future direction of national policy. However for several reasons, the advance estimate may prove to be relatively high and paint a portrait of an economy that is stronger than it actually is.
Explains Calculated Risk:
In a research note released last night, Goldman Sachs raised their estimate of Q4 GDP from 4.0% to 5.8%. They cautioned that the ‘headline will be an eye-popper’, but that this growth is mostly due to inventory changes: ‘More than two-thirds of our estimated increase comes from a sudden stabilization in inventories’. They also noted ‘anything between 4½% and 7% is possible given the volatility of the inventory data’.
…
The rest of the note cautions on 2010, and Goldman still sees sluggish growth of just under 2.0% with the unemployment rate peaking in early 2011.
…
This is what we’ve been discussing – GDP boosted by inventory changes in the 2nd half of 2009, followed by sluggish growth in 2010.
Meanwhile, Paul Krugman of The New York Times places the potential “blip” in historical context:
[Calculated Risk] asks when we last saw growth that high combined with rising unemployment, and says 1981. That’s true. However, the last time we saw an initial report of 5.8 percent growth combined with rising unemployment is much more recent: the first quarter of 2002. The quarter’s growth was later revised down, but at the time there was much unwarranted celebration (unemployment didn’t peak until summer 2003).
19.01.2010
Policy Points
In November, the United States imported more goods and services from abroad than it exported, according to the most recent report from the Bureau of Economic Analysis. Compared to the revised October data, the November trade deficit was greater and the levels of of both imports and exports were higher
 The graph (left) shows the changes in American imports and exports that have occurred since the start of the recession in December 2007.
The recession has reduced American demand for foreign goods and services and foreign demand for American goods and services (though the fall in the dollar’s value likely is boosting American exports).
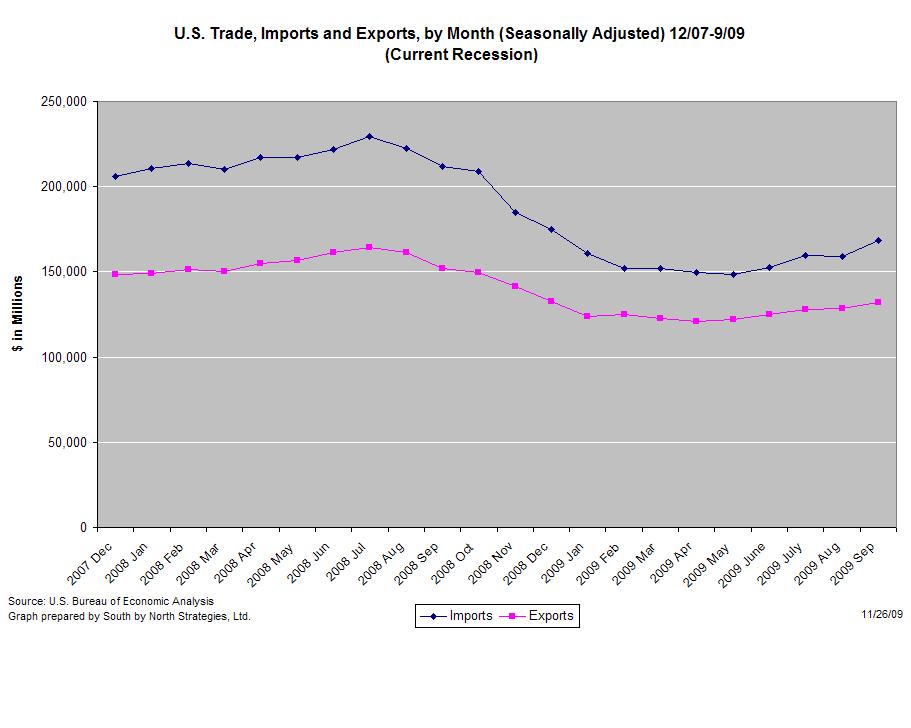
Compared to a year ago (seasonally adjusted), U.S. imports were 5.5 percent lower while exports were 2.3 percent lower. In recent months, both imports and exports have been trending upwards, as has been the trade deficit.
 Last month, the U.S. imported $36.4 billion more than it exported (graph right). When imports of petroleum products are excluded, the trade gap was $27.1 billion.
Compared to one year ago (seasonally adjusted), the non-petroleum trade deficit is 17 percent lower and the overall trade deficit is 15 percent lower.
18.01.2010
Policy Points
Economic policy reports, blog postings, and media stories of interest:
18.01.2010
Policy Points
A new report from the North Carolina Budget & Tax Center looks at the progress that North Carolina has made to close the racial achievement gap among public school students. Using results from end-of-grade tests, high school end-of-course tests, the Scholastic Aptitude Test, and the National Assessment of Educational Progress, the report concludes the following:
These limited efforts have not only failed to fulfill the promise to close the achievement gap, a decade later the gap has not even narrowed. On every measure, minority students are still failing to achieve the success of their peers. American Indian, black, and Hispanic students continue to have significantly lower standardized test scores than white students. They have higher dropout rates and lower graduation rates, are under-represented in programs for the gifted and disproportionally disciplined with suspensions and expulsions.


 Email Sign-Up
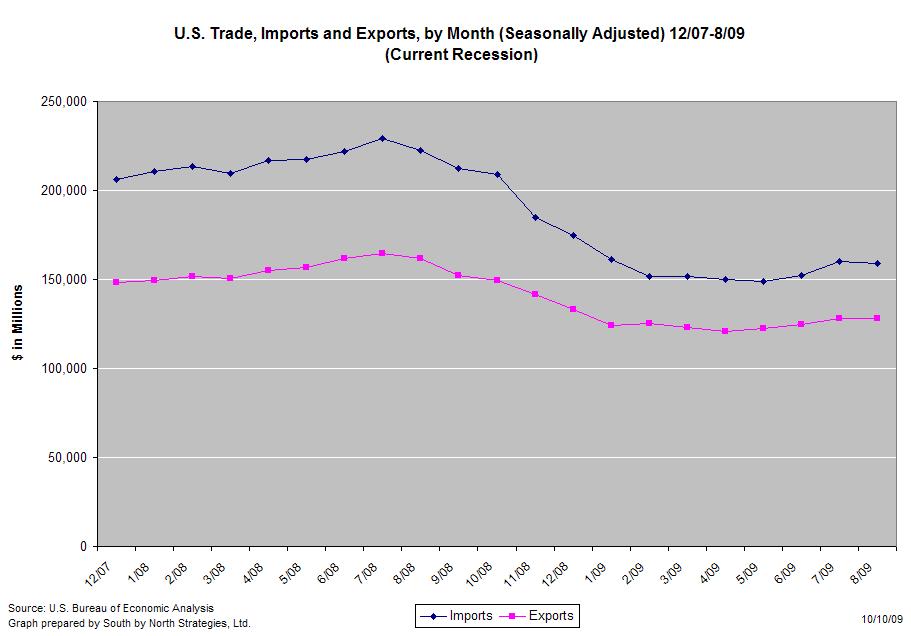