Policy Points
30.11.2009
Policy Points
Economic policy reports, blog postings, and media stories of interest:
30.11.2009
Policy Points
In September, the seasonally-adjusted home prices of single-family units rose in 11 of the 20 metro areas tracked by the S&P/Case-Shiller Housing Price Indicies. Despite those increases, sales price levels in all 20 markets remain significantly lower than they were one year ago. 
The graph (right) shows changes in price indices for selected metros. Data are shown for Charlotte, certain peer metros in the South Atlantic, and, for purposes of regional comparisons, San Diego and Cleveland. The composite measure for all 20 metros also is shown.
While Charlotte never experienced the same housing bubble seen in other metros, housing prices, as measured by the index, have fallen by 8.1 percent over the past year. And Charlotte was one of nine metros tracked in the survey that recorded a month-to-month decline in prices. Although most of the price tracked by the S&P.Case-Shiller Indicies have risen over the past few months, those trends don’t necessarily mean that the housing bubble has fully deflated. Explains Calculated Risk:
It appears that house prices – in general – are still too high. However prices depend on the local supply and demand factors. In many lower priced bubble areas supply has declined sharply (because of the loan modification efforts and local moratoria), and demand was very strong in Q3 from the first-time home buyer frenzy and cash flow investors. This has pushed up prices at the low end, and suggests price might fall some again at the low end – although probably not to new lows.
…
However in the mid-to-high end of the bubble areas – with significant supply and little demand – prices are still too high.
30.11.2009
Policy Points
From the Federal Reserve Bank of Richmond’s October survey of manufacturing activity in the South Atlantic (District of Columbia, Maryland, North Carolina, South Carolina, Virginia and West Virginia):
Manufacturing activity in the central Atlantic region expanded for the seventh straight month but was virtually flat on balance this month, according to the Richmond Fed’s latest survey. Looking at the main components of activity, growth in shipments and new orders tapered off, while employment returned to negative territory after being positive for the last two months. Other indicators were generally in line with a month ago. Capacity utilization continued to grow more slowly, while backlogs edged slightly lower than a month ago. Vendor delivery times were virtually unchanged, while manufacturers reported slower growth in inventories.
…
Looking forward, assessments of business prospects for the next six months were generally on par with last month’s readings. Firms looked for steady growth in shipments, new orders, capacity utilization and capital expenditures in the months ahead, while they expected employment to stabilize and reverse its negative reading that was seen last month.
25.11.2009
Policy Points
Policy Points will not be updated over the Thanksgiving holiday. Regular posting will resume on Monday, November 30, 2009.
Have a Happy Thanksgiving!
25.11.2009
Policy Points
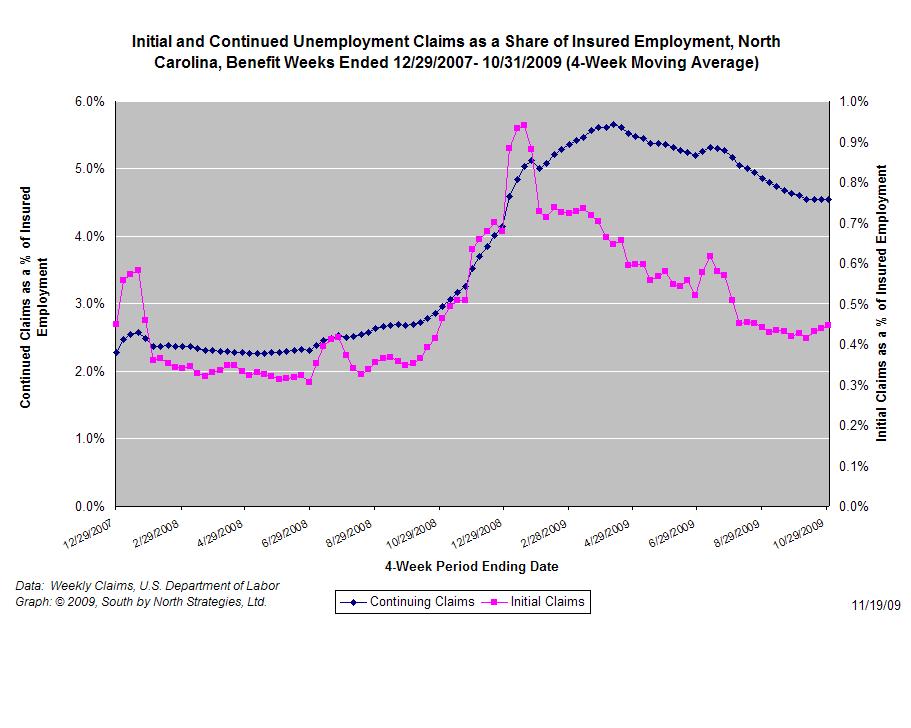
For the benefit week ending on November 7th, 17,184 North Carolinians filed initial claims for unemployment insurance, and 179,243 individuals applied for continuing insurance benefits. Compared to the prior week, there were fewer initial and continuing claims. These figures come from data released today by the U.S. Department of Labor.
Averaging new and continuing claims over a four-week period — a process that helps adjust for seasonal fluctuations and better illustrates trends — shows that an average of 18,048 initial claims were filed over the last four weeks, along with an average of 180,045 continuing claims. Compared to the previous four-week period, both initial and continuing claims were slightly higher.

One year ago, the four-week average for initial claims stood at 19,857 and the four-week average of continuing claims equaled 122,929.
The graph shows the changes in unemployment insurance claims (as a share of covered employment) in North Carolina since the recession’s start in December 2007.
Although new and continuing claims appear to have peaked for this cycle, the claims levels remain elevated and point to a labor market that remains extremely weak.


 Email Sign-Up
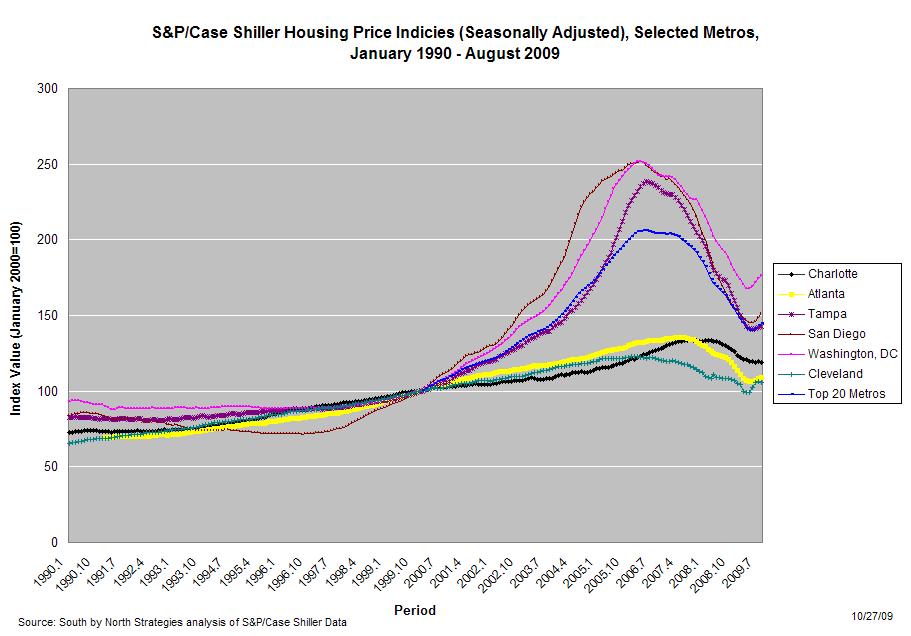