

NC Job Market Stumbles Through Sept.
CHAPEL HILL (October 21, 2011) – North Carolina’s job market stumbled through September, ending the month with 22,200 fewer payroll jobs than with which it started. After accounting for those losses, the state had just 0.2 percent more jobs than was the case at the start of 2011. Not only was September the worst month for job losses so far in 2011, but it also saw both the monthly number of unemployed individuals and the unemployment rate hit annual highs. These findings come from new data from the Employment Security Commission of North Carolina.
“September erased virtually all of the meager progress that North Carolina’s job market had made during the first eight months of 2011,” said John Quinterno, a principal with South by North Strategies, Ltd., a research firm specializing in economic and social policy. “Sizable losses in the private and public sectors canceled out more than three-fourths of the job gains recorded earlier in the year.”
In September, North Carolina employers cut 22,200 more payroll jobs than they added. Net losses occurred primarily in the public sector (-13,700 driven by a net loss of 16,400 local government jobs), while the private sector shed 8,500 jobs. May was the only other month in 2011 in which the private sector lost jobs, on net (also -8,500). Within the private sector, financial activities lost the most jobs in absolute terms (-3,000), followed by trade, transportation, and utilities (-2,100), education and health services (also -2,100), and leisure and hospitality services (-1,900). Construction gained the most jobs in absolute terms (+2,800).
A positive revision to the August data found that the state gained 2,900 more payroll jobs than first reported (+19,400, versus an original estimate of +16,500). With that adjustment, North Carolina has lost, on net, 308,600 positions, or 7.4 percent of its payroll base, since December 2007. Since bottoming out in February 2010, the state has netted an average of 758 payroll jobs per month, resulting in a cumulative gain of just 14,400 positions (+0.4 percent)
“Compared to December 2007, North Carolina has fewer payroll jobs in every major industry group except for educational and health services and leisure and hospitality services,” noted Quinterno. “While public-sector employment had been a source of strength earlier in the downturn, it now is weighing on growth. Since February 2010, local government employment has fallen by 4.7 percent with state government employment declining by 5.3 percent.”
Between September 2010 and September 2011, North Carolina gained, on net, 9,700 jobs (+ 0.3 percent). Net public-sector losses (-18,700) offset some two-thirds of the net growth that occurred in the private sector (+28,400 positions). In terms of individual private industries, professional and business services grew the most in absolute terms (+11,600, +2.4 percent). In the public sector, net losses stemmed from declines in state (-10,800, -5.5 percent) and local employment (-8,300, -1.9 percent).
The household data for September also were troubling. Last month, the size of the workforce rose slightly (+5,822, +0.1 percent) to 4.5 million. While the total number of employed individuals rose somewhat, most of the additional workers in the labor force joined the ranks of the unemployed (+4,498, +1 percent). In September, the number of unemployed workers reached an annual high, as well as the highest monthly total recorded since June 2010.
Over the year, the number of unemployed North Carolinians rose by 28,123 (+6.3 percent), while the number of employed individuals remained essentially flat at 4 million. Between September 2010 and September 2011, the size of the labor force increased by 32,370 individuals (+0.7 percent). Over the year, the unemployment rate rose to 10.5 percent from 10 percent. The September unemployment rate was the highest monthly one posted so far in 2011 and the highest one posted since June 2010, when the monthly rate also was 10.5 percent.
“North Carolina’s labor market has made no meaningful progress so far in 2011,” observed Quinterno. “The job gap has closed only marginally since January, and the unemployment rate has been trending upward since May. Especially alarming is the fact that the share of working-age North Carolinians with a job remains at the lowest level recorded since 1976. In September, 55.3 percent of working-age North Carolinians had jobs. This represents both a waste of human talent and a source of economic hardship for households and communities across the state.”
“The September job report illustrates that North Carolina, like the nation as a whole, is being savaged by a severe job crisis–a crisis that, by many indicators, is worsening. The seeming passivity of policymakers and civic leaders in the face of a crisis of such severity is becoming harder and harder to understand or accept.”
Pay Falls In 2010
David Cay Johnston reports on “awful” new data on jobs and pay from the Social Security Administration.
The median paycheck — half made more, half less — fell again in 2010, down 1.2 percent to $26,364. That works out to $507 a week, the lowest level, after adjusting for inflation, since 1999.
…
The number of Americans with any work fell again last year, down by more than a half million from 2009 to less than 150.4 million.
…
More significantly, the number of people with any work has fallen by 5.2 million since 2007, when the worst recession since the Great Depression began, with a massive taxpayer bailout of Wall Street following in late 2008. This means 3.3 percent of people who had a job in 2007, or one in every 33, went all of 2010 without earning a dollar.
…
In addition to the 5.2 million people who no longer have any work add roughly 4.5 million people who, due to population growth, would normally join the workforce in three years and you have close to 10 million workers who did not find even an hour of paid work in 2010.
Around The Dial – October 20, 2011
Economic policy reports, blog postings, and media stories of interest:
- Katrina vanden Heuvel asks about “the silence of the elites.”
- Economix graphs patterns in charitable giving.
- Martin Wolf sees “no sunlit future for the euro.”
- TaxVox points out the raw deal that is “9-9-9.”
NC Unemployment Claims: Week Of 10/1/11
For the benefit week ending on October 1, 2011, some 12,846 North Carolinians filed initial claims for state unemployment insurance benefits, and 102,807 individuals applied for state-funded continuing benefits. Compared to the prior week, there were fewer initial and continuing claims. These figures come from data released by the U.S. Department of Labor.
Averaging new and continuing claims over a four-week period — a process that helps adjust for seasonal fluctuations and better illustrates trends — shows that an average of 12,282 initial claims were filed over the previous four weeks, along with an average of 104,159 continuing claims. Compared to the previous four-week period, the average number of initial claims was higher, while the average number of continuing claims was lower.
One year ago, the four-week average for initial claims stood at 13,787 and the four-week average of continuing claims equaled 117,870.
While the number of claims has dropped over the past year so has covered employment. Last week, covered employment totaled 3.7 million, down from 3.8 million a year ago.
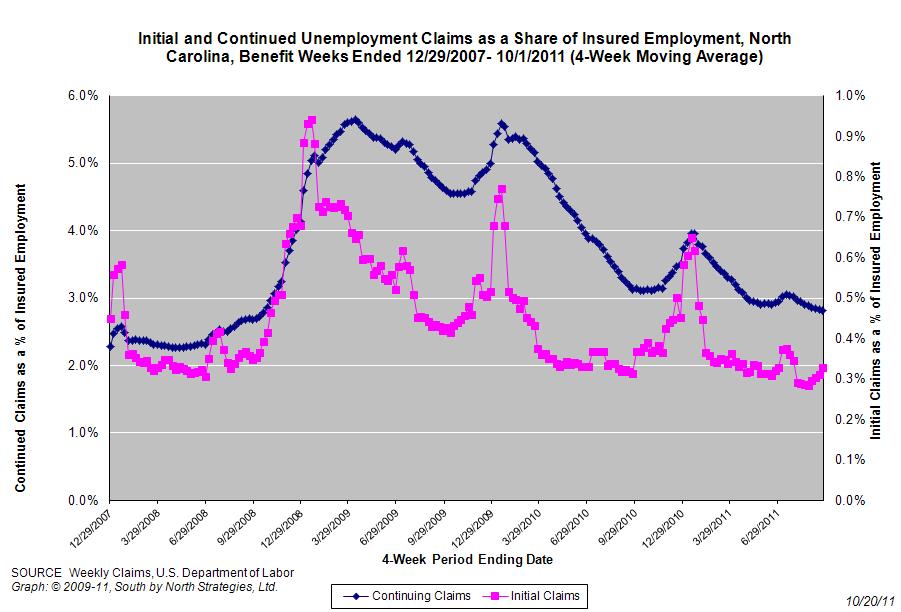 The graph shows the changes in unemployment insurance claims (as a share of covered employment) in North Carolina since the recession’s start in December 2007.
Both new and continuing claims appear to have peaked for this cycle, and the four-week averages of new and continuing claims have fallen considerably. Yet continuing claims remain at an elevated level, which suggests that unemployed individuals are finding it difficult to find new positions.
Lessons In Inequality
Rortybomb thinks about how the Occupy Wall Street movement talks about economic inequality and how those arguments differ from traditional ones about economic fairness.
What about the 99%? I’ve previously looked through the We Are the 99% Tumblr and found that the biggest emphasis was on debt, ranging from student loans to medical debt, and a lack of enough employment to get by month-to-month. Here inequality is less a problem related to the more traditional liberal concerns of fairness or the idea that a few are left behind, and more a problem in which inequality is making indentured peasants of a huge part of the population. Risks are shifted to individuals who are already struggling, opportunities and possibilities are ruthlessly revoked, employment is nonexistent, and month-to-month survival is a battle for more than the just the very bottom….
…
This ties into traditional liberal concerns. Liberals want institutions that allow people to develop their talents and also ones that insure them against the bad luck of health and unemployment. These institutions have been unraveled, and their public nature has been replaced with debt. And when people involved in Occupy Wall Street talk about this phenomenon, they connect how debt functions as a new safety net with the experience of servitude and suffering. Not in a relative sense of inferiority and shame (although that’s there too), but in actual deprivation and the feeling of powerlessness against creditors, bosses, and the top of the elite.
 Email Sign-Up
 RSS Feed