

NC Unemployment Claims: Week Of 6/21/14
For the benefit week ending on June 21, 2014, North Carolinians filed some 5,356 initial claims for state unemployment insurance benefits and 51,416 claims for state-funded continuing benefits. Compared to the prior week, there were fewer initial claims and more continuing claims. These figures come from data released by the US Department of Labor.
Averaging new and continuing claims over a four-week period — a process that helps adjust for seasonal fluctuations and better illustrates trends — shows that an average of 5,573 initial claims were filed over the previous four weeks, along with an average of 51,593 continuing claims. Compared to the previous four-week period, the average number of initial claims was higher, and the average number of continuing claims was lower.
One year ago, the four-week average for initial claims stood at 10,787, and the four-week average of continuing claims equaled 86,573.
In recent months covered employment has increased and now exceeds the level recorded a year ago (3.89 million versus 3.82 million). Nevertheless, there are still fewer covered workers than there were in January 2008, which means that payrolls are smaller today than they were more than six years ago.
The graph (below right) shows the changes in unemployment insurance claims measured as a share of covered employment in North Carolina since the recession’s start in December 2007.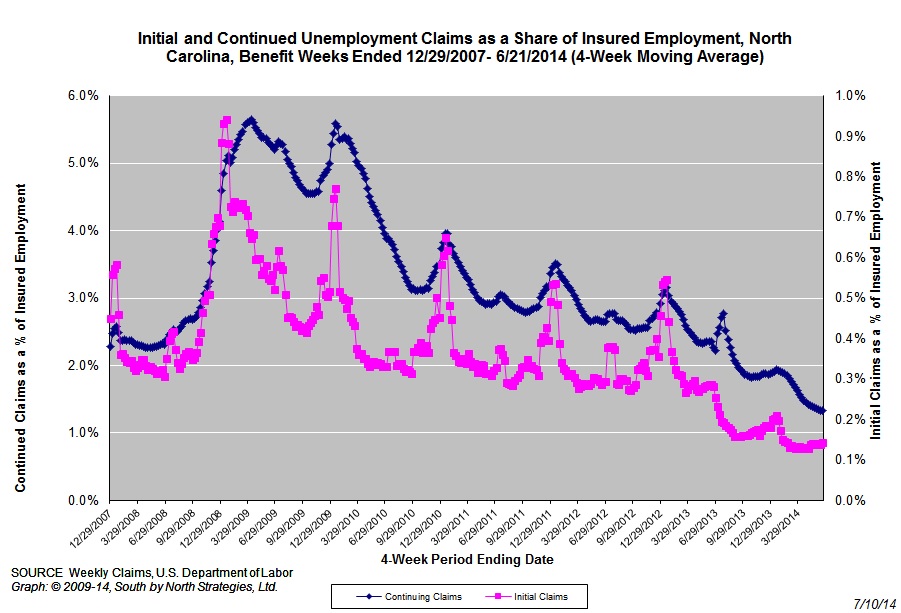
Both new and continuing claims have peaked for this cycle, and the four-week averages of new and continuing claims have fallen considerably. The four-week average of initial claims, when measured as a share of covered employment, is near the lowest level recorded since early 2008, while the four-week average of continuing claims also is near the lowest level recorded since early 2008.
Note that the recent declines in new and continuing claims are not necessarily indicative of an improving labor market. State legislation that took effect on July 1, 2013, made major changes to insurance eligibility criteria, and the more stringent criteria eliminate claims that would have been valid prior to July 1. Additionally, the legislation reduced the maximum number of weeks of state-funded insurance for which a claimant is eligible — an action that should reduce the number of continuing claims.
To place the numbers in context, consider how the four-week average of initial claims (5,573) was 48.3 percent lower than the figure recorded one year ago (10,787), while the average number of continuing claims was 40.4 percent lower (51,593 versus 86,573). Given the modest rate of job growth that has occurred in North Carolina over the past year, such declines likely are products of changes to unemployment insurance laws rather than improvements in underlying economic conditions.
NC Unemployment Claims: Week Of 6/14/14
For the benefit week ending on June 14, 2014, North Carolinians filed some 5,785 initial claims for state unemployment insurance benefits and 51,160 claims for state-funded continuing benefits. Compared to the prior week, there were more initial claims and fewer continuing claims. These figures come from data released by the US Department of Labor.
Averaging new and continuing claims over a four-week period — a process that helps adjust for seasonal fluctuations and better illustrates trends — shows that an average of 5,390 initial claims were filed over the previous four weeks, along with an average of 52,006 continuing claims. Compared to the previous four-week period, the average number of initial claims was higher, and the average number of continuing claims was lower.
One year ago, the four-week average for initial claims stood at 10,938, and the four-week average of continuing claims equaled 89,960.
In recent months covered employment has increased and now exceeds the level recorded a year ago (3.89 million versus 3.82 million). Nevertheless, there are still fewer covered workers than there were in January 2008, which means that payrolls are smaller today than they were more than six years ago.
The graph (below right) shows the changes in unemployment insurance claims measured as a share of covered employment in North Carolina since the recession’s start in December 2007.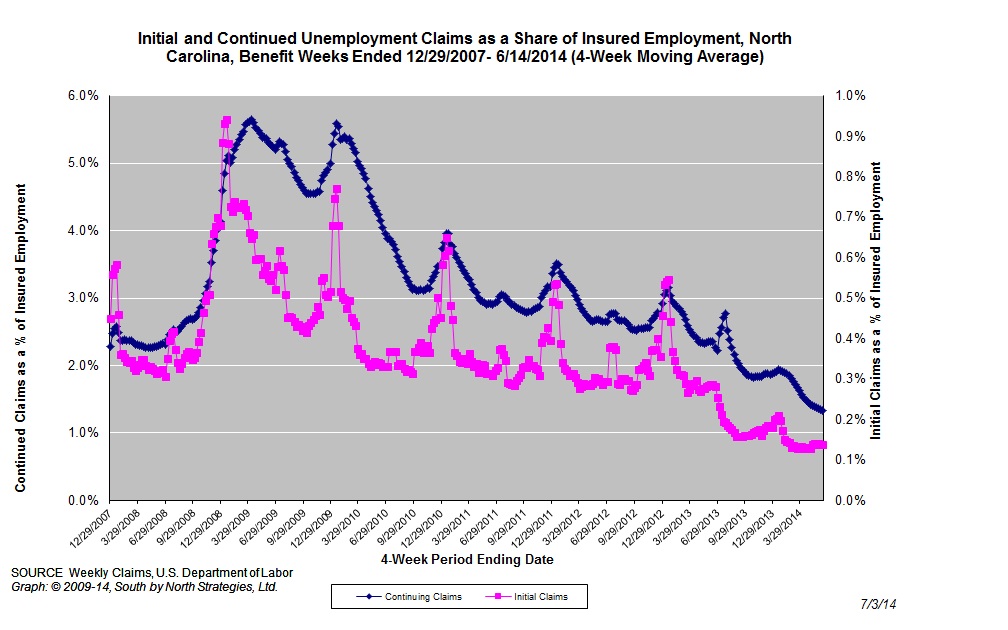
Both new and continuing claims have peaked for this cycle, and the four-week averages of new and continuing claims have fallen considerably. The four-week average of initial claims, when measured as a share of covered employment, is near the lowest level recorded since early 2008, while the four-week average of continuing claims also is near the lowest level recorded since early 2008.
Note that the recent declines in new and continuing claims are not necessarily indicative of an improving labor market. State legislation that took effect on July 1, 2013, made major changes to insurance eligibility criteria, and the more stringent criteria eliminate claims that would have been valid prior to July 1. Additionally, the legislation reduced the maximum number of weeks of state-funded insurance for which a claimant is eligible — an action that should reduce the number of continuing claims.
To place the numbers in context, consider how the four-week average of initial claims (5,785) was 47.1 percent lower than the figure recorded one year ago (10,938), while the average number of continuing claims was 43.1 percent lower (51,160 versus 89,960). Given the modest rate of job growth that has occurred in North Carolina over the past year, such declines likely are products of changes to unemployment insurance laws rather than improvements in underlying economic conditions.
US Labor Market Improves In June
CHAPEL HILL, NC (July 3, 2014) – In June, the national labor market added 288,000 more jobs than it lost due primarily to gains in the private sector. At the same time, the national unemployment rate dropped to 6.1 percent. The drop in unemployment was a positive development attributable to more people reporting themselves as being employed. Nevertheless, unemployment in the United States remains elevated, while other important measures of labor utilization remain near depressed levels.
“June was the 45th-straight month in which the United States experienced net job growth,” said John Quinterno, a principal with South by North Strategies, Ltd., a research firm specializing in economic and social policy. “Over the year, the economy has netted an average of 208,000 jobs per month, a pace that, while positive, still is insufficient to replace all of the jobs lost since 2007 and to accommodate subsequent population growth.”
In June, the nation’s employers added 288,000 more payroll jobs than they cut. Some 91 percent of the gain originated in the private sector (+262,000), while public employers added 26,000 more positions than they cut. Within the private sector, payroll levels rose the most in the trade, transportation, and utilities sector (+72,000, with 55.8 percent of the gain originating in the retail trade subsector), followed by the professional business services sector (+67,000, with 51.3 percent of the gain occurring in the administrative and waste services subsector), the leisure and hospitality services sector (+39,000, with 89.7 percent of the gain originating in the accommodation and food service sector), and the education and health services sector (+38,000). Payroll levels in the other major industry groups either rose in June or essentially held steady.
Additionally, the payroll employment numbers for April and May underwent revisions; with the updates, the economy netted 528,000 jobs over those two months, not the 499,000 positions previously reported. With those changes, the average pace of monthly job growth in the United States recorded over the past year rose to 208,000 from 198,000.
“The United States has experienced steady job growth for the past 3.75 years, but the pace of growth has been modest relative to the severity of the job losses caused by the last recession,” noted Quinterno. “The current average monthly rate of job growth is insufficient to close the nation’s jobs gap—a gap now estimated at 6.7 million jobs—anytime soon.”
Data from the household survey offered additional positive news about the health of the United States’ labor market. In June, the number of Americans who reported having jobs rose by 407,000 (+0.3 percent); put differently, more people reported having jobs in June than in May. At the same time, the overall size of the labor force rose by 81,000 persons (+0.1 percent) between May and June. Meanwhile, the share of working-age Americans participating in the labor force held steady in June, while the share of working-age Americans with a job ticked up over the month.
In June, 9.5 million Americans were unemployed (6.1 percent), while 7.5 million individuals worked part time despite preferring full-time positions. Another 676,000 individuals (not seasonally adjusted) were so discouraged about their job prospects that they had stopped searching for work altogether. Those persons were part of a larger population of 2.1 million Americans who were marginally attached to the labor force.
Compared to a year ago, 2.1 million more Americans were working in June, and 2.3 million fewer persons were unemployed. At the same time, the share of the working-age population with a job (59 percent) remained at a depressed level, while the share of the population that was participating in the labor force decreased over the year, falling to 62.8 percent from 63.5 percent.
Last month, the unemployment rate was higher among adult male workers than female ones (5.7 percent versus 5.3 percent). Unemployment rates were higher among Black (10.7 percent) and Hispanic workers (7.8 percent) than among white ones (5.3 percent). The unemployment rate among teenagers was 21 percent.
Additionally, 5.4 percent of all veterans were unemployed in June, and the rate among recent veterans (served after September 2001) was 7 percent. At the same time, 12.9 percent of Americans with disabilities were jobless and seeking work (not seasonally adjusted).
Jobs remained comparatively hard to find in June. Last month, the underemployment rate equaled 12.1 percent, down from the 14.2 percent rate logged a year ago. Among unemployed workers, 32.8 percent had been jobless for at least six months, as opposed to 36.9 percent a year earlier, and the average spell of unemployment equaled 33.5 weeks, down from 35.7 weeks in May 2013.
In June, the leading cause of unemployment remained a job loss or the completion of a temporary job, which was the reason cited by 51.2 percent of unemployed persons. Another 28.5 percent of unemployed persons were re-entrants to the labor market, while 11.2 percent were new entrants. Voluntary job leavers accounted for the remaining 9 percent of the total.
“The June employment report painted a portrait of a national job market that is showing improvements but remains far from healed,” observed Quinterno. “The magnitude of the problems stemming from the ‘Great Recession’ combined with the painfully prolonged recovery have obscured just how unusual current conditions are and have created a distorted picture of what a robust job market would look like.”
Local Unemployment Rates Drop Over The Year
CHAPEL HILL, NC (July 1, 2014) – Between May 2013 and May 2014, unemployment rates fell in all 100 counties in North Carolina and in all 14 of the state’s metropolitan areas. Yet over the same period, the size of the labor force decreased in in 73 counties and in 7 metro areas.
These findings come from new estimates released by the Labor and Economic Analysis Division of the North Carolina Department of Commerce.
“Local unemployment rates fell across all of North Carolina over the past year, with the unadjusted statewide rate falling by 1.6 percentage points,” said John Quinterno, a principal with South by North Strategies, Ltd., a research firm specializing in economic and social policy. “Many local labor markets now have some of the lowest rates of unemployment logged since late 2007, yet rates still remain elevated. In fact, 67 counties and 14 metro areas posted unemployment rates greater than those recorded six years ago.”
Compared to December 2007, which is when the national economy fell into recession, North Carolina now has 1.1 percent fewer payroll jobs (-45,700). In May, the state added 5,700 more jobs than it lost (+0.1 percent). Since bottoming out in February 2010, the state’s labor market has netted some 5,551 jobs per month, resulting in a cumulative gain of 283,100 positions (+7.4 percent). At that rate, all else equal, it would take until early 2015 for the state to have as many payroll jobs as it did at the end of 2007.
Between April 2014 and May 2014, local unemployment rates increased in 92 of the state’s 100 counties, decreased in 7 counties, and held constant in 1 county. Individual county rates in May ranged from 4.6 percent in Currituck County to 12.7 percent in Scotland County. Overall, 3 counties posted unemployment rates greater than or equal to 10 percent, and 63 counties posted rates between 6.6 and 9.9 percent. (Because seasonal fluctuations in the labor market are particularly pronounced in May, month-to-month changes provide limited insight into trends.)
“Non-metropolitan labor markets continue to struggle relative to metropolitan ones,” noted Quinterno. “In May, 7.4 percent of the non-metro labor force was unemployed, compared to 6.3 percent of the metro labor force. Compared to December 2007, the non-metro labor force now has 3.6 percent fewer employed persons, while the number of unemployed individuals is 28.7 percent larger. Over that time, the size of the non-metro labor force has fallen by 1.8 percent.”
Between April and May, unemployment rates rose in all 14 of the state’s metro areas. Rocky Mount had the highest unemployment rate (9.8 percent), followed by Fayetteville (7.7 percent) and Hickory-Morganton-Lenoir (7.1 percent). Asheville had the lowest unemployment rate (5.1 percent), followed by Durham-Chapel Hill (5.3 percent) and Raleigh-Cary (5.4 percent).
Compared to May 2013, unemployment rates in May 2014 were lower in all 100 counties and all 14 metro areas. Over the year, however, labor force sizes decreased in 73 counties and in 7 metros. In fact, the statewide labor force (seasonally adjusted) was 0.2 percent smaller (-8,307 individuals) in May 2014 than it was in May 2013.
Among metros, Rocky Mount’s labor force contracted at the greatest rate (-2.1 percent) over the course of the year, followed by Fayetteville (-1.7 percent) and Jacksonville and Hickory-Morganton-Lenoir (-1.5 percent). With those changes, metro areas now are home to 72.1 percent of the state’s labor force, with 50.9 percent of the labor force residing in the Triangle, Triad, and Charlotte metros.
In the long term, improvements in overall labor market conditions depend on growth in the Charlotte, Research Triangle, and Piedmont Triad regions. Yet growth in these metros, although improved in recent months, remains subdued. Collectively, employment in the three metro regions has risen by 6.8 percent since December 2007, and the combined unemployment rate in May totaled 6.1 percent (compared to 5.4 percent in May 2008). Of the three broad regions, the Research Triangle had the lowest May unemployment rate (5.5 percent), followed by Charlotte (6.5 percent) and the Piedmont Triad (6.6 percent).
The local employment report for May also provided insights into the effects of the extensive changes to the state’s system of unemployment insurance implemented over the summer. Last month, the number of regular unemployment insurance initial claims filed in North Carolina totaled 23,306, down from the 48,287 initial claims filed a year earlier (-51.7 percent).
Mecklenburg County was home to greatest number of regular initial claims (2,728), followed by Wake (1,981), Guilford (1,600), Forsyth (929), and Cumberland (817) counties.
In May 2014, North Carolinians received a (nominal) total of $36.5 million in regular state-funded and federal unemployment insurance compensation, down from the (nominal) $177.5 million received in May 2013. This sharp decline (-79.4 percent) is attributable to a mix of factors, such as drops in the number of insurance claims resulting from economic improvements and legal changes that restricted eligibility for insurance compensation.
Additionally, the state’s decision to exit the federal Emergency Unemployment Compensation (EUC) program reduced the amount of federal unemployment insurance compensation flowing into the state in May. Between May 2013 and May 2014, the amount of federal unemployment insurance benefits paid to North Carolinians fell by 98.8 percent, dropping to a (nominal) total of $1.1 million from a (nominal) total of $89.1 million. (Note that the US Congress allowed the EUC program to expire at the start of 2014.)
“Despite recent improvements in some important labor market indicators, labor market conditions in communities across North Carolina still have not returned to their pre-recessionary states,” said Quinterno. “The May data showed little deviation from the basic pattern that has characterized the state’s labor market for the past four years: a sluggish recovery that is not generating enough job opportunities, rapidly enough for working North Carolinians.”
Progress At The Margins In May Jobs Report
CHAPEL HILL, NC (June 20, 2014) – In May, employers in North Carolina added 5,700 more payroll positions than they cut (+0.1 percent), due entirely to growth in the private sector. The monthly household survey, meanwhile, recorded an uptick in unemployment, with the statewide unemployment rate rising to 6.4 percent, which was equal to the rate logged this past February. Nevertheless, North Carolina still has 1.1 percent fewer payroll jobs, 31.6 more unemployed residents, and an unemployment rate that is 1.4 percentage points higher than it did almost 6.5 years ago.
These findings come from new data released today by the Labor and Economic Analysis Division of the NC Department of Commerce.
“The May employment report contained signs of marginal progress, even though overall labor market conditions in North Carolina remained far from healthy,” said John Quinterno, a principal with South by North Strategies, Ltd., a research firm specializing in economic and social policy. “Last month, North Carolina netted relatively few payroll jobs, yet the labor force expanded, which led to a rise in unemployment and the unemployment rate. This increase must be interpreted cautiously, however, given the seasonal factors often at work at this time of year.”
Between April 2014 and May 2014, North Carolina employers added 5,700 more jobs than they cut (+0.1 percent). Private-sector payrolls netted 6,100 positions (+0.2 percent), but public-sector payrolls shed, on net, 400 jobs (-0.1 percent). Within private industry, the leisure and hospitality services sector netted the most jobs (+7,400, with 63.5 percent of the increase originating in the accommodation and food services subsector), followed by trade, transportation, warehousing, and utilities sector (+2,300, with 56.5 percent of the gain originating in the wholesale trade subsector). Meanwhile, the professional and business services sector shed 3,400 more jobs than it added (all of the losses occurred in the administrative and waste management subsector), followed by the manufacturing sector (-2,200, with losses split equally between the durable and non-durable goods subsectors).
A revision to the April 2014 payroll data found that the state gained 2,700 more jobs that month than first estimated (+18,000 versus +15,300). With the revision, North Carolina has, on net, 45,700 fewer payroll positions (-1.1 percent) than it did in December 2007. Since bottoming out in February 2010, the state has netted an average of 5,550 payroll jobs per month, resulting in a cumulative gain of 283,100 positions (+7.4 percent). At that rate, holding all else equal, it would take until early 2015 for the state to have as many jobs as it did at the end of 2007.
“While positive, the pace of payroll growth in North Carolina has not accelerated radically over the past year,” explained Quinterno. “Between May 2013 and May 2014, the total number of payroll jobs in North Carolina grew by 1.9 percent, a rate similar to those seen in prior years. Between May 2012 and May 2013, the total of number payroll jobs in North Carolina rose by 1.6 percent, while between May 2011 and May 2012, the rate of growth was 1.8 percent. The bottom line is that North Carolina has experienced the same basic rate of job growth for several years in a row.”
The household data recorded in May contained some positive news about the state’s labor market. Last month, the statewide unemployment rate rose by 0.2 percentage points to 6.4 percent, which was same rate logged in February of this year. An increase in the size of the labor force contributed to that increase. After accounting for that growth, 10,187 more North Carolinians (+0.2 percent) had jobs in May than in April, and 8,795 more persons were unemployed (+3 percent). These data, however, should be interpreted cautiously due to the seasonal dynamics often at work at the start of summer.
While the changes in household data recorded between April and May seemed positive, the data for changes over the past year were more mixed. Between May 2013 and May 2014, the number of unemployed North Carolinians fell by 90,299 persons (-23.1 percent), but 9.2 percent of the decline was attributable to people who left the labor force entirely. If those 8,307 persons were added back to the labor force and considered unemployed, the statewide unemployment rate in May would have equaled 6.6 percent. Even if 50 percent of those individuals were added back to the labor force and considered unemployed, the statewide unemployment rate would have equaled 6.5 percent.
Year-over-year declines in the statewide labor force participation rate provide additional evidence of a labor market that is performing poorly. In May 2014, the share of working-age North Carolinians participating in the labor market equaled 61.3 percent, which was up from the 61.1 percent figure logged in April but lower than the 62.1 percent figure recorded a year ago. Even though the labor force participation rose in May for the second straight month, it remains close to the lowest monthly figure recorded at any point since January 1976.
Although another important measure of labor utilization, the employment-to-population ratio, rose over the year, the current share of working-age North Carolinians with a job (57.4 percent) was just 1.1 percentage points above the 38-year low of 56.3 percent posted in summer 2011.
The May labor market report provided additional insight into the effects of the extensive changes to the state’s system of unemployment insurance implemented last summer. Between April and May, the number of claimants of regular state-funded insurance fell by 5.6 percent, dropping to 42,382 from 44,892. Compared to a year earlier, 48,476 fewer individuals received regular state-funded insurance in May (-53.4 percent).
Also in May, the state paid a (nominal) total of $35.4 million in regular state-funded unemployment insurance compensation, an amount 60 percent lower than the (nominal) total of $88.4 million paid in May 2013.
“Despite some recent progress around the margins of the state’s labor market, conditions remain far from healthy. Look beyond the important-yet-limited measure of the unemployment rate, and one will see a labor market that is netting jobs at the same sluggish pace that has characterized the past few years. North Carolina simply still is struggling with the consequences of the last recession”
 Email Sign-Up