

No Surprises In April Jobs Report For NC
CHAPEL HILL, NC (May 16, 2014) – In April, employers in North Carolina added 15,300 more payroll positions than they cut (+0.4 percent), due entirely to growth in the private sector. The monthly household survey, meanwhile, recorded a drop in unemployment, with the statewide unemployment rate falling to 6.2 percent, which was the lowest monthly rate logged since the middle of 2008. Nevertheless, North Carolina still has fewer payroll jobs, more unemployed residents, and a higher unemployment rate than it did some 6.25 years ago.
These findings come from new data released today by the Labor and Economic Analysis Division of the NC Department of Commerce.
“The April employment report is another entry in the series of mixed reports recorded over the last few months,” said John Quinterno, a principal with South by North Strategies, Ltd., a research firm specializing in economic and social policy. “In April, North Carolina experienced a rmodest gain in the total number of payroll jobs in the state for the second month in a row. Yet compared to year earlier, a smaller share of the state’s working-age population was participating in the labor force.”
Between March 2014 and April 2014, North Carolina employers added 15,300 more jobs than they cut (+0.4 percent). Private-sector payrolls netted 16,800 positions (+0.5 percent), but public-sector payrolls shed, on net, 1,500 jobs (-0.2 percent). Within private industry, the professional and business services sector netted the most jobs (+7,600, with 86.8 percent of the increase originating in the administrative and waste management subsector), followed by the leisure and hospitality sector (+5,600 jobs, with all of the increase originating in the accommodation and food service subsector) and the trade, transportation, warehousing, and utilities sector (+2,200, with almost all of the gain originating in the retail trade subsector). Meanwhile, the construction sector shed the most payroll jobs (-2,500), followed by the education and health services sector (-1,400).
A revision to the March 2014 payroll data found that the state gained 1,700 fewer jobs that month than first estimated (+17,700 versus +19,400). With the revision, North Carolina has, on net, 54,100 fewer payroll positions (-1.3 percent) than it did in December 2007. Since bottoming out in February 2010, the state has netted an average of 5,494 payroll jobs per month, resulting in a cumulative gain of 274,700 positions (+7.2 percent). At that rate, holding all else equal, it would take until February 2015 for the state to have as many jobs as it did at the end of 2007.
“While positive, the pace of payroll growth in North Carolina has not quickened over the past year,” explained Quinterno. “Between April 2013 and April 2014, the total number of payroll jobs in North Carolina grew by 1.4 percent, a rate similar to those seen in prior years. Between April 2012 and April 2013, the total of number payroll jobs in North Carolina rose by 1.7 percent, while between April 2011 and April 2012, the rate of growth also was 1.7 percent. From April 2010 to April 2011, the rate of growth was 1.4 percent. No matter how one cuts the data, North Carolina has experienced the same basic slow rate of job growth for the last four years.”
The household data recorded in April contained some positive news about the state’s labor market. Last month, the statewide unemployment rate fell by 0.1 percentage points to 6.2 percent, which was the lowest monthly rate logged since mid-2008. Additionally, 14,104 more North Carolinians had jobs in April (+0.3 percent) than in March, and 4,193 fewer persons were unemployed (-1.4 percent). And over the month, the size of the state’s labor force essentially held steady at 4.7 million.
While the changes in household data recorded between March and April seemed positive, the data for changes over the past year were less so. Between April 2013 and April 2014, the number of unemployed North Carolinians fell by 102,377 (-26 percent) persons, but 32.2 percent of the decline was attributable to people who left the labor force entirely. If those 33,005 persons were added back to the labor force and considered unemployed, the statewide unemployment rate in April would have equaled 6.9 percent. Even if 50 percent of those individuals were added back to the labor force and considered unemployed, the statewide unemployment rate would have equaled 6.6 percent.
Year-over-year declines in the statewide labor force participation rate provide additional evidence of a labor market that is not growing rapidly enough to accommodate all those who want and need work. In April 2014, the share of working-age North Carolinians participating in the labor market equaled 61.1 percent, down from 62.2 percent in April 2013. Even though the labor force participation rose in April for the first time since late 2011, it remains close to the lowest monthly figure recorded at any point since January 1976.
Although another important measure of labor utilization, the employment-to-population ratio, rose over the year, the current share of working-age North Carolinians with a job (57.3 percent) was just 1 percentage point above the 38-year low of 56.3 percent posted in the summer of 2011.
The April labor market report provided additional insight into the effects of the extensive changes to the state’s system of unemployment insurance implemented over the summer. Between March and April, the number of claimants of regular state-funded insurance fell by 14.8 percent, dropping to 44,892 from 52,666. Compared to a year earlier, 52,750 fewer individuals received regular state-funded insurance in April (-53.8 percent).
Also in April, the state paid a (nominal) total of $38.5 million in regular state-funded unemployment insurance compensation, an amount 61.2 percent lower than the (nominal) total of $99.2 million paid in April 2013.
“Despite recent declines in the statewide unemployment rate, labor market conditions in North Carolina remain far from healthy. Look beyond the important yet limited measure of the unemployment rate, and one will see labor market dynamics broadly consistent with the sluggish ones that have characterized the past four years. Some four years into a recovery, North Carolina still has fewer jobs and more unemployment than it did before the recession.”
NC Unemployment Claims: Week Of 4/26/14
For the benefit week ending on April 26, 2014, North Carolinians filed some 5,015 initial claims for state unemployment insurance benefits and 55,133 claims for state-funded continuing benefits. Compared to the prior week, there were fewer initial claims and fewer continuing claims. These figures come from data released by the US Department of Labor.
Averaging new and continuing claims over a four-week period — a process that helps adjust for seasonal fluctuations and better illustrates trends — shows that an average of 5,011 initial claims were filed over the previous four weeks, along with an average of 56,401 continuing claims. Compared to the previous four-week period, the average number of initial claims was lower, and the average number of continuing claims was lower.
One year ago, the four-week average for initial claims stood at 10,480, and the four-week average of continuing claims equaled 90,228.
In recent months covered employment has increased and now exceeds the level recorded a year ago (3.89 million versus 3.82 million). Nevertheless, there are still fewer covered workers than there were in January 2008, which means that payrolls are smaller today than they were more than six years ago.
The graph (below right) shows the changes in unemployment insurance claims measured as a share of covered employment in North Carolina since the recession’s start in December 2007.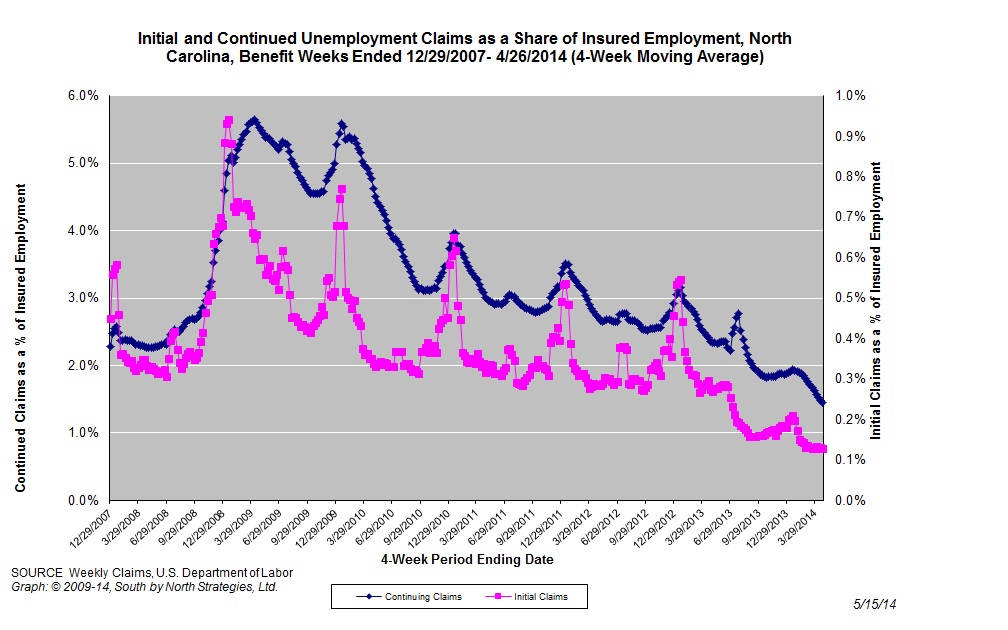
Both new and continuing claims have peaked for this cycle, and the four-week averages of new and continuing claims have fallen considerably. The four-week average of initial claims, when measured as a share of covered employment, is at the lowest level recorded since early 2008, while the four-week average of continuing claims also is at the lowest level recorded since early 2008.
Note that the recent declines in new and continuing claims are not necessarily indicative of an improving labor market. State legislation that took effect on July 1, 2013, made major changes to insurance eligibility criteria, and the more stringent criteria eliminate claims that would have been valid prior to July 1. In time, this development also should reduce the number of continuing claims. Additionally, the legislation reduced the maximum number of weeks of state-funded insurance for which a claimant is eligible — an action that eventually should lead to a reduction in the number of continuing claims.
To place the numbers in context, consider how the four-week average of initial claims (5,011) was 52.2 percent lower than the figure recorded one year ago (10,480), while the average number of continuing claims was 37.8 percent lower (56,104 versus 90,228). Given the modest rate of job growth that has occurred in North Carolina over the past year, such declines likely are products of changes to unemployment insurance laws rather than improvements in underlying economic conditions.
NC Unemployment Claims: Week Of 4/19/14
For the benefit week ending on April 19, 2014, North Carolinians filed some 5,115 initial claims for state unemployment insurance benefits and 55,977 claims for state-funded continuing benefits. Compared to the prior week, there were more initial claims and fewer continuing claims. These figures come from data released by the US Department of Labor.
Averaging new and continuing claims over a four-week period — a process that helps adjust for seasonal fluctuations and better illustrates trends — shows that an average of 5,048 initial claims were filed over the previous four weeks, along with an average of 57,565 continuing claims. Compared to the previous four-week period, the average number of initial claims was higher, and the average number of continuing claims was lower.
One year ago, the four-week average for initial claims stood at 11,299, and the four-week average of continuing claims equaled 92,024.
In recent months covered employment has increased and now exceeds the level recorded a year ago (3.88 million versus 3.81 million). Nevertheless, there are still fewer covered workers than there were in January 2008, which means that payrolls are smaller today than they were more than six years ago.
The graph (below right) shows the changes in unemployment insurance claims measured as a share of covered employment in North Carolina since the recession’s start in December 2007.
Both new and continuing claims have peaked for this cycle, and the four-week averages of new and continuing claims have fallen considerably. The four-week average of initial claims, when measured as a share of covered employment, is at the lowest level recorded since early 2008, while the four-week average of continuing claims also is at the lowest level recorded since early 2008.
Note that the recent declines in new and continuing claims are not necessarily indicative of an improving labor market. State legislation that took effect on July 1, 2013, made major changes to insurance eligibility criteria, and the more stringent criteria eliminate claims that would have been valid prior to July 1. In time, this development also should reduce the number of continuing claims. Additionally, the legislation reduced the maximum number of weeks of state-funded insurance for which a claimant is eligible — an action that eventually should lead to a reduction in the number of continuing claims.
To place the numbers in context, consider how the four-week average of initial claims (5,048) was 55.3 percent lower than the figure recorded one year ago (11,299), while the average number of continuing claims was 37.4 percent lower (57,565 versus 92,024). Given the modest rate of job growth that has occurred in North Carolina over the past year, such declines likely are products of changes to unemployment insurance laws rather than improvements in underlying economic conditions.
US Labor Market Takes A Wild Ride In April
CHAPEL HILL, NC (May 2, 2014) – In April, the national labor market added 288,000 more jobs than it lost (+2.1 percent) due mainly to gains in the private sector. This net gain was the largest one logged in any month since January 2012 and was the third-largest monthly gain recorded since October 2010. Yet the household data painted a more negative picture of the labor market, with the number of employed persons actually declining in April.
“April was the 43rd-straight month in which the United States experienced net job growth,” said John Quinterno, a principal with South by North Strategies, Ltd., a research firm specializing in economic and social policy. “Over the year, the economy has netted an average of 197,000 jobs per month, but it still remains 7.1 million jobs short of the total needed to replace the jobs lost since 2007 and to meet subsequent population growth.”
In April, the nation’s employers added 288,000 more payroll jobs than they cut (+2.1 percent). Some 95 percent of the gain came from the private sector (+273,000), while public employers added 15,000 more positions than they cut. Within the private sector, payroll levels rose the most in the professional business services sector (+75,000, with 51.5 percent of the gain occurring in the administrative and waste services subsector), followed by the trade, transportation, and utilities sector (+59,000, with 58.5 percent of the gain occurring in the retail trade subsector) and the education and health services sector (+40,000, with 69.8 percent of the gain occurring in the health care and the social assistance subsector). Payroll levels in the other major industry groups rose or held steady.
Additionally, the payroll employment numbers for February and March underwent revisions; with the updates, the economy netted 425,000 jobs over those two months, not the 389,000 positions previously reported. With those changes, the average pace of monthly job growth in the United States recorded over the past year rose to 197,000 from 194,000.
“While the United States has experienced steady job growth for the past 3.5 years, the pace of growth has been modest relative to the severity of the job losses caused by the last recession,” noted Quinterno. “The current average monthly rate of job growth is insufficient to close the nation’s jobs gap anytime soon.”
Data from the household survey, meanwhile, offered a more negative picture of the state of the United States’ labor market. In April, the number of Americans who reported having jobs actually decreased by 73,000 persons (-0.1 percent); put differently, fewer people reported having jobs in April than in March. And the overall size of the labor force declined by 806,000 persons between March and April. Compared to March, fewer Americans participated in the labor force in April, and the share of working-age people with a job was unchanged.
In April, 9.8 million Americans were unemployed (6.3 percent), while 7.5 million individuals worked part time despite preferring full-time positions. Another 783,000 individuals (not seasonally adjusted) were so discouraged about their job prospects that they had stopped searching for work altogether. Those persons were part of a larger population of 2.2 million Americans who were marginally attached to the labor force.
Compared to a year ago, 2 million more Americans were working in April, and 1.9 million fewer persons were unemployed. At the same time, the share of the working-age population with a job (58.9 percent) remained at a depressed level, while the share of the population that was participating in the labor force actually decreased over the year, falling to 62.8 percent from 63.4 percent.
Last month, the unemployment rate was higher among adult male workers than female ones (5.9 percent versus 5.7 percent). Unemployment rates were higher among Black (11.6 percent) and Hispanic workers (7.3 percent) than among white ones (5.3 percent). The unemployment rate among teenagers was 19.1 percent.
Additionally, 5.6 percent of all veterans were unemployed in April, and the rate among recent veterans (served after September 2001) was 6.8 percent. At the same time, 12.5 percent of Americans with disabilities were jobless and seeking work (not seasonally adjusted).
Jobs remained comparatively hard to find in April. Last month, the underemployment rate equaled 12.3 percent, down from the 13.9 percent rate logged a year ago. Among unemployed workers, 35.3 percent had been jobless for at least six months (compared to 37.4 percent a year earlier), and the average spell of unemployment equaled 35.1 weeks, down from 36.6 weeks in April 2013.
In April, the leading cause of unemployment remained a job loss or the completion of a temporary job, which was the reason cited by 54.1 percent of unemployed persons. Another 27.1 percent of unemployed persons were re-entrants to the labor market, while 10.8 percent were new entrants. Voluntary job leavers accounted for the remaining 8.1 percent of the total.
“The April employment report painted a mixed portrait of the American labor market,” observed Quinterno. “The payroll survey contained positive findings, but the data in the household survey were much more negative. While the economy is netting jobs at a somewhat more robust pace than first thought, it is not adding enough jobs, rapidly enough to provide employment opportunities to all those who want and need work. Even with the recent drops in the unemployment rate, the United States’ jobs crisis remains far from over.”
NC Unemployment Claims: Week Of 4/12/14
For the benefit week ending on April 12, 2014, North Carolinians filed some 4,378 initial claims for state unemployment insurance benefits and 56,689 claims for state-funded continuing benefits. Compared to the prior week, there were fewer initial claims and fewer continuing claims. These figures come from data released by the US Department of Labor.
Averaging new and continuing claims over a four-week period — a process that helps adjust for seasonal fluctuations and better illustrates trends — shows that an average of 4,978 initial claims were filed over the previous four weeks, along with an average of 59,378 continuing claims. Compared to the previous four-week period, the average number of initial claims was lower, and the average number of continuing claims was lower.
One year ago, the four-week average for initial claims stood at 10,975, and the four-week average of continuing claims equaled 92,992.
In recent months covered employment has increased and now exceeds the level recorded a year ago (3.88 million versus 3.81 million). Nevertheless, there are still fewer covered workers than there were in January 2008, which means that payrolls are smaller today than they were more than six years ago.
The graph (below right) shows the changes in unemployment insurance claims measured as a share of covered employment in North Carolina since the recession’s start in December 2007.
Both new and continuing claims have peaked for this cycle, and the four-week averages of new and continuing claims have fallen considerably. The four-week average of initial claims, when measured as a share of covered employment, is at the lowest level recorded since early 2008, while the four-week average of continuing claims also is at the lowest level recorded since early 2008.
Note that the recent declines in new and continuing claims are not necessarily indicative of an improving labor market. State legislation that took effect on July 1, 2013, made major changes to insurance eligibility criteria, and the more stringent criteria eliminate claims that would have been valid prior to July 1. In time, this development also should reduce the number of continuing claims. Additionally, the legislation reduced the maximum number of weeks of state-funded insurance for which a claimant is eligible — an action that eventually should lead to a reduction in the number of continuing claims.
To place the numbers in context, consider how the four-week average of initial claims (4,978) was 54.6 percent lower than the figure recorded one year ago (10,975), while the average number of continuing claims was 36.1 percent lower (59,378 versus 92,992). Given the modest rate of job growth that has occurred in North Carolina over the past year, such declines likely are products of changes to unemployment insurance laws rather than improvements in underlying economic conditions.
 Email Sign-Up