

Debating The Poverty Measure
From a commentary by Shawn Fremstad of the Center for Economic and Policy Research …
The extent to which the current poverty measure has defined deprivation down can be seen by comparing the poverty line’s movement over time with public opinion on the minimum income families need to make ends meet. For several decades, Gallup has asked adults: “What is the smallest amount of money a family of four (husband, wife, and two children) needs each week to get along in this community?” When it was initially developed, the official poverty line was equal to about 72 percent of the average response to this “minimum get-along” question. By 2007, the poverty line had fallen to 41 percent of the average response to the get-along question (the 2007 poverty line was $21,500; the minimum get-along average was $52,087). If the poverty line had kept pace with public opinion on the minimum get-along amount over time (that is, remained equal to 72 percent of that amount), the poverty line would have been $37,500 in 2007 rather than $21,500.
Adds Fremstad about the development of the current measure …
In essence, the current federal poverty measure started out as a measure of very low income and ended up as a measure of extremely low income. The reasons for this are far from politically neutral. The beginnings of the shift toward an ideologically conservative approach to measuring poverty date to the late 1960s. As Gordon Fisher notes, in 1968, the Johnson administration prohibited the Social Security Administration from “tak[ing] a very modest step toward raising the poverty thresholds to reflect increases in the general standard of living,” a decision that would have increased the poverty threshold by 8 percent in real terms. This decision appears to have been an ad hoc one, driven by the administration’s short-term political need to avoid reporting an increase in poverty five years after declaring “war” on it. However, when the Nixon administration adopted the poverty measure as an official statistic in 1969, it formalized the disconnection between poverty and living standards by tying the official measure to the Consumer Price Index, without making any allowance for real increases in living standards. The disconnection was further solidified when the administration failed to act on recommendations made by a federal interagency task force in 1973 to update the measure for changes in living standards.
Around The Dial – June 2
Economic policy reports, blog postings, and media stories of interest:
- Calculated Risk analyzes the impact of census hiring on the jobs report.
- Christina Romer of the CEA explains how to prevent teacher layoffs.
- Brad DeLong asks if Washington care about unemployment.
- EconoSpeak wonders if we’ve reached “a political economy moment.”
The State of the South: 2010
In the first installment of the 2010 State of the South Report, MDC, Inc. analyzes the region’s lost economic decade. The report find that the developments of the last decade have cost the region much of the social and economic progress made between 1980 and 2000. Moreover, the sluggish recovery poses a threat to the region’s future prosperity. From the report …
The hard realities embedded in these data pose difficult yet urgent issues for state and local policymakers. A consensus has formed that job growth will not become robust enough in the near future to both absorb new entrants into the labor market and to put all of today’s unemployed back to work. Even given a modest recovery, no amount of industry recruiting is likely to dig the South out of the deep job-loss hole anytime soon. What can, and should, the states and communities of the South do in the face of stunning job losses, especially in factories, construction trades, and finance, where Southern minorities and men had clustered? While states have much less ability to apply stimulus than the federal government, they have tools at their disposal, including assistance to small businesses, encouraging innovation, preparing the way for “green” jobs in energy and environmental endeavors, and—it should be on the table—considering opportunities for public-financed jobs to alleviate pockets of debilitating distress.
State Cuts to Education and Services
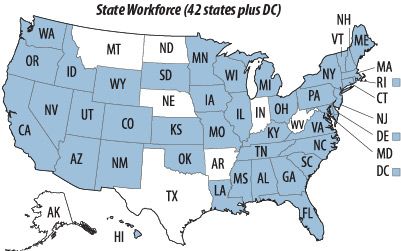
The Center on Budget and Policy Priorities has prepared a series of maps detailing state cuts to public education, higher education, public health, elder assistance, disability aid, and state workforces. Below is one map showing states that have reduced their workforces.
Around The Dial – June 1
Economic policy reports, blog postings, and media stories of interest:
- Robert Reich asks why deficit hawks are killing the recovery.
- The News & Observer reports on the foreclosure trap.
- Paul Krugman writes about “the pain caucus.”
 Email Sign-Up
 RSS Feed