Housing Price Indicies: Oct.
In October, the seasonally-adjusted home prices of single-family units rose in 11 of the 20 metro areas tracked by the S&P/Case-Shiller Housing Price Indicies. Despite those increases, sales price levels in all 20 markets remain significantly lower than they were one year ago.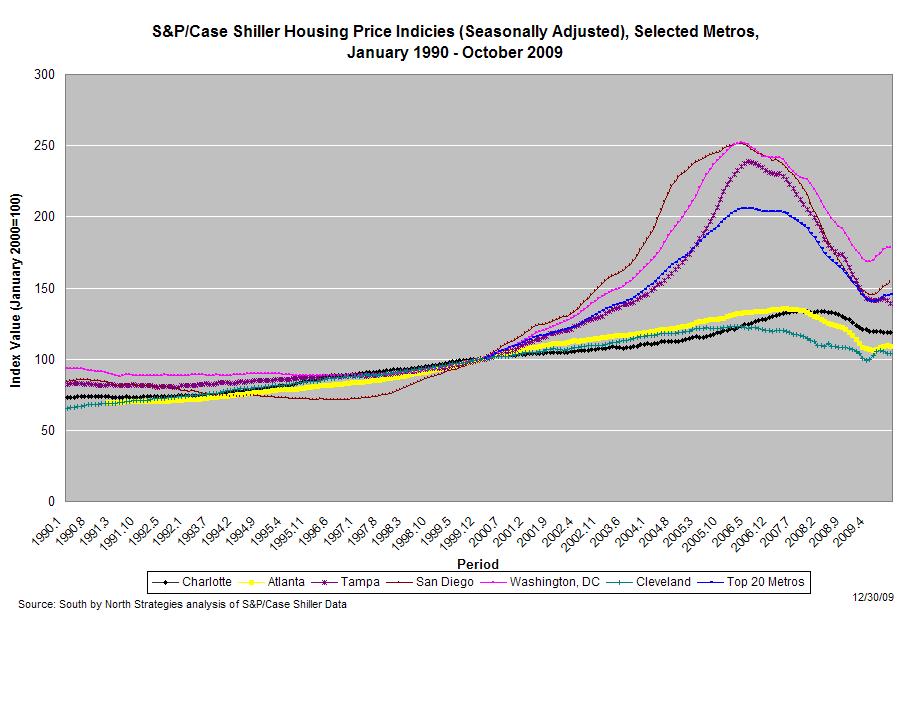
The graph (right) shows changes in price indices for selected metros. Data are shown for Charlotte, certain peer metros in the South Atlantic, and, for purposes of regional comparisons, San Diego and Cleveland. The composite measure for all 20 metros also is shown.
While Charlotte never experienced the same housing bubble seen in other metros, housing prices, as measured by the index, have fallen by 7.1 percent over the past year and by 10.9 percent since the start of the recession. And Charlotte was one of 11 metros tracked in the survey that recorded a month-to-month decline in prices. Although most of the price tracked by the S&P/Case-Shiller Indicies have risen over the past few months, those trends don’t necessarily mean that the housing bubble has fully deflated. Explains Calculated Risk:
The impact of the massive government effort to support house prices led to small increases in prices over the Summer, and the question is what happens to prices as these programs end over the next 6 months.
Around the Dial – Jan. 5
Economic policy reports, blog postings, and media stories of interest:
- In The Charlotte Observer, Bank of America’s new CEO assesses the health of the industry.
- Speaking on Raleigh, Federal Reserve Governor Elizabeth Duke forecasts 2010.
- In The New York Times, Paul Krugman has “that 1937 feeling.”
- The Baseline Scenario weighs in on Ben Bernanke’s reconfirmation.
November Local Employment: North Carolina
The local employment report for November detailed few positive changes in local employment conditions across North Carolina.
In November, every part of the state experienced weak labor markets. Unemployment rates exceeded 10 percent in 68 counties, and in 33 counties, at least 12 percent of the labor force was jobless and actively seeking work. County unemployment rates ranged from 6.3 percent in Orange County to 16.6 percent in Edgecombe County. Altogether, unemployment in the state’s non-metropolitan counties was higher than in its metropolitan ones — 11.8 percent versus 10.2 percent.
Compared to one year ago, unemployment rates were higher in every North Carolina County and metro area. And compared to a year ago, 59 counties and 10 metro areas had smaller labor forces. Among metropolitan areas, Jacksonville posted the largest decline in the size of its labor force (-2.8 percent), followed by Hickory-Morganton-Lenoir (-1.2 percent) and Durham-Chapel Hill (-1 percent).
Click here to read South by North Strategies’ full analysis of the latest employment report.
Sadly, No Employment Surprises
CHAPEL HILL (January 5, 2010) – November brought few positive changes in local employment conditions across North Carolina. Last month, 68 counties posted double-digit unemployment rates; of these, 33 had unemployment rates of at least 12 percent. These findings come from preliminary data released today by the Employment Security Commission.
“Job losses in North Carolina appear to have bottomed out in July, but few improvements have occurred since then,” says John Quinterno, a principal at South by North Strategies, Ltd., a research firm specializing in economic and social policy. “Local labor markets are just drifting along the bottom of the recession.”
The statewide labor market struggled in November. Last month, employers shed 8,800 more positions than they added with the private sector accounting for 8,500 of the lost positions. Since the recession’s onset, North Carolina has lost, on net, 250,000 payroll jobs – a number equivalent to 6 percent of all the jobs that existed in December 2007. Last month, 10.7 percent of the labor force was unemployed (unadjusted rate).
In November, every part of the state experienced weak labor markets. Unemployment rates exceeded 10 percent in 68 counties, and in 33 counties, at least 12 percent of the labor force was jobless and actively seeking work. County unemployment rates ranged from 6.3 percent in Orange County to 16.6 percent in Edgecombe County. Altogether, unemployment in the state’s non-metropolitan counties was higher than in its metropolitan ones — 11.8 percent versus 10.2 percent.
Unemployment also remained at elevated levels in all 14 of the state’s metropolitan areas. In November, six metros posted double-digit unemployment rates. The Hickory-Morganton-Lenoir area had the highest unemployment rate (14.4 percent) followed by Rocky Mount (13.6 percent). The lowest metro unemployment rate was 7.6 percent in Durham-Chapel Hill.
“Because of the lack of seasonal adjustments, monthly fluctuations in local unemployment rates must be interpreted cautiously, especially at this time of year,” warns Quinterno. “The better comparison is to contrast data from November 2009 to November 2008.”
Compared to one year ago, unemployment rates were higher in every North Carolina County and metro area. And compared to a year ago, 59 counties and 10 metro areas had smaller labor forces. Among metropolitan areas, Jacksonville posted the largest decline in the size of its labor force (-2.8 percent), followed by Hickory-Morganton-Lenoir (-1.2 percent) and Durham-Chapel Hill (-1 percent).
“When combined with other employment data, the November report shows a labor market that is going nowhere fast,” adds Quinterno. “Although the number of newly-unemployed individuals has fallen, the number of unemployed individuals who remain jobless has increased. This has led to a surge in the number of households experiencing financial hardships. For instance, some 578,000 North Carolina households received food stamps last month, a 23-percent increase from a year ago.”
In the long-term, private-sector job creation, especially in the state’s three major metro areas, is essential to any meaningful recovery. Yet that growth is not occurring. In November, the unemployment rate stood at 12.4 percent in Charlotte, 11.1 percent in the Piedmont Triad, and 8.4 percent in the Research Triangle. Compared to one year ago, all three major regions had unemployment rates that were at least 1.4 times greater and smaller labor forces.
“Right now there is a tremendous amount of idle labor in North Carolina,” says Quinterno. “Even though conditions have stabilized in recent months, what growth is occurring is insufficient to bring down joblessness and is extremely dependent upon federal recovery programs, which will begin to phase out later in 2010.”
Unemployment Claims in NC: Week of 12/12
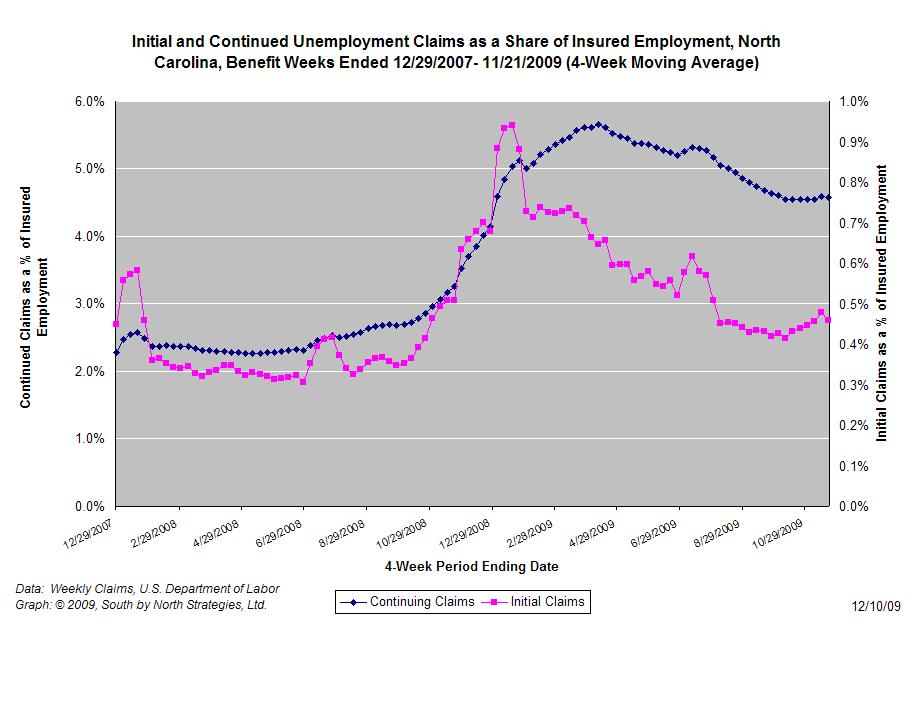
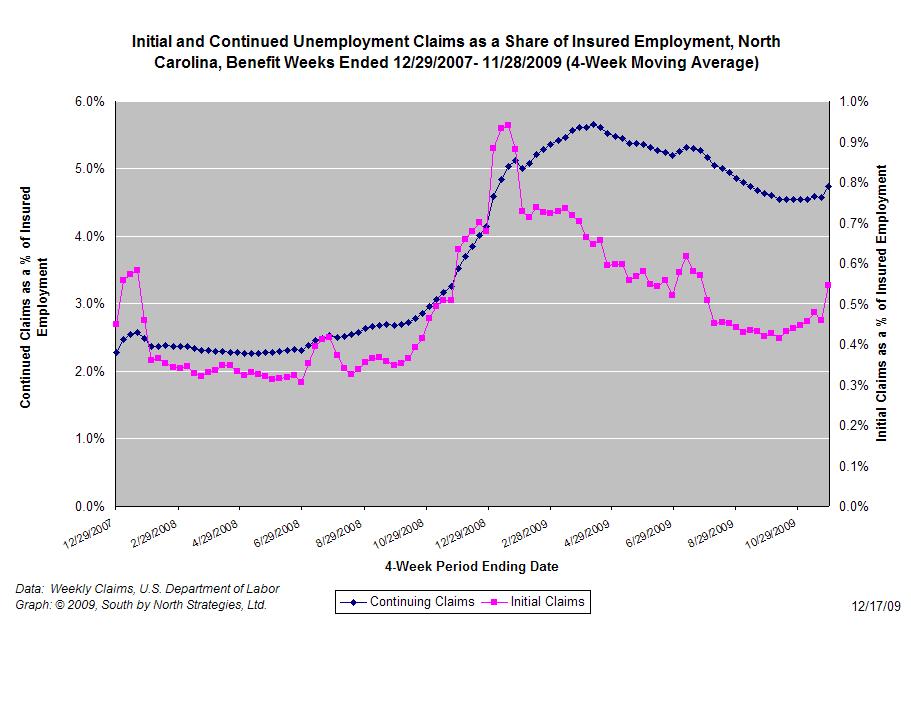
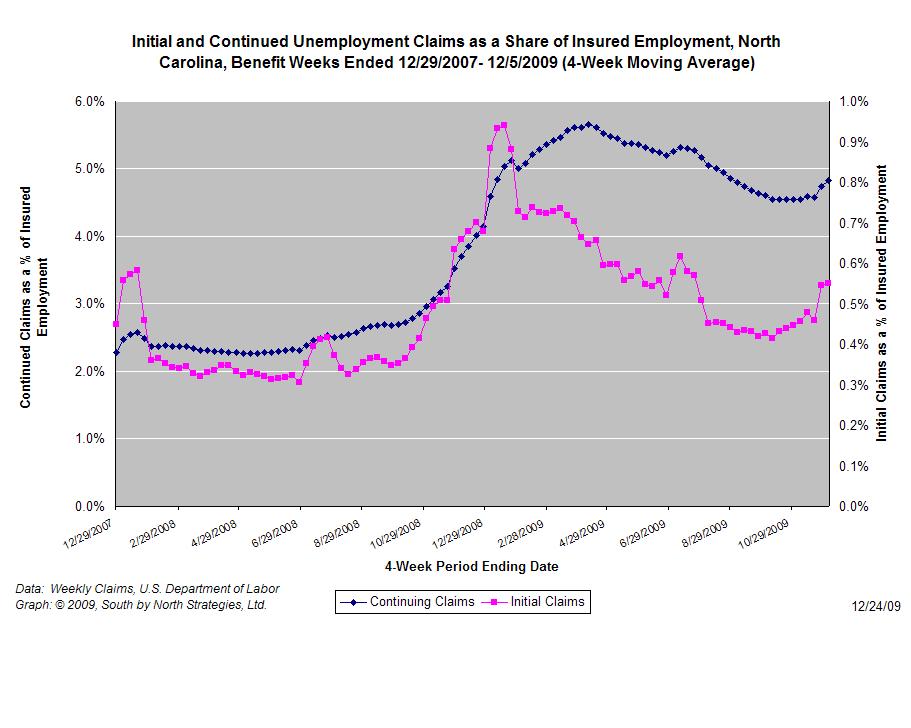
For the benefit week ending on December 12th, 16,223 North Carolinians filed initial claims for state unemployment insurance benefits, and 192,297 individuals applied for state-funded continuing insurance benefits. Compared to the prior week, there were fewer initial and continuing claims. These figures come from data released today by the U.S. Department of Labor.
Averaging new and continuing claims over a four-week period — a process that helps adjust for seasonal fluctuations and better illustrates trends — shows that an average of 20,113 initial claims were filed over the last four weeks, along with an average of 192,006 continuing claims. Compared to the previous four-week period, initial claims were lower and continuing claims were higher.
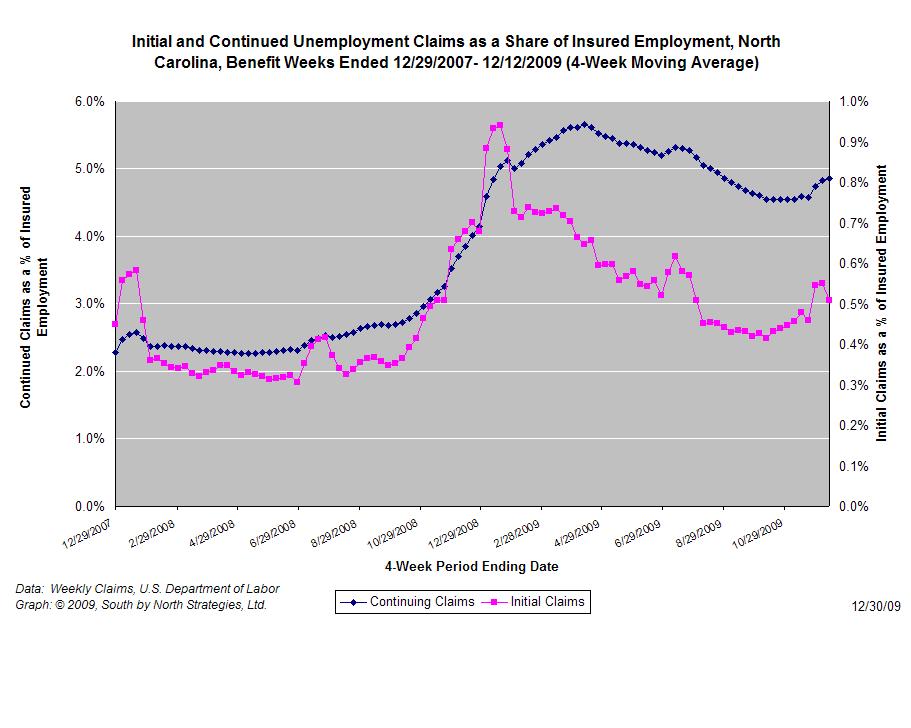
One year ago, the four-week average for initial claims stood at 27,210 and the four-week average of continuing claims equaled 154,790.
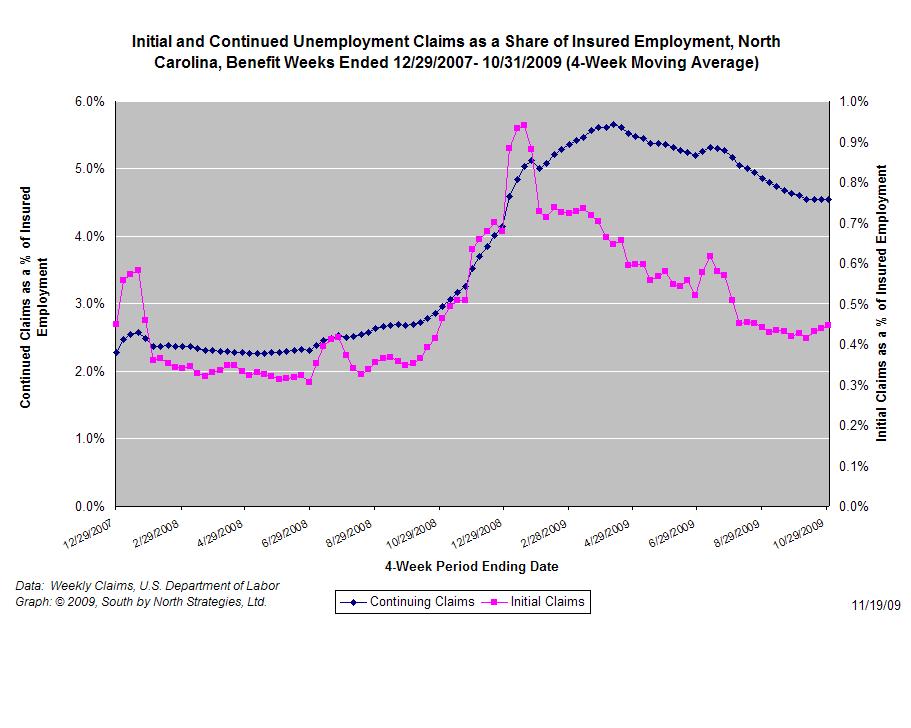
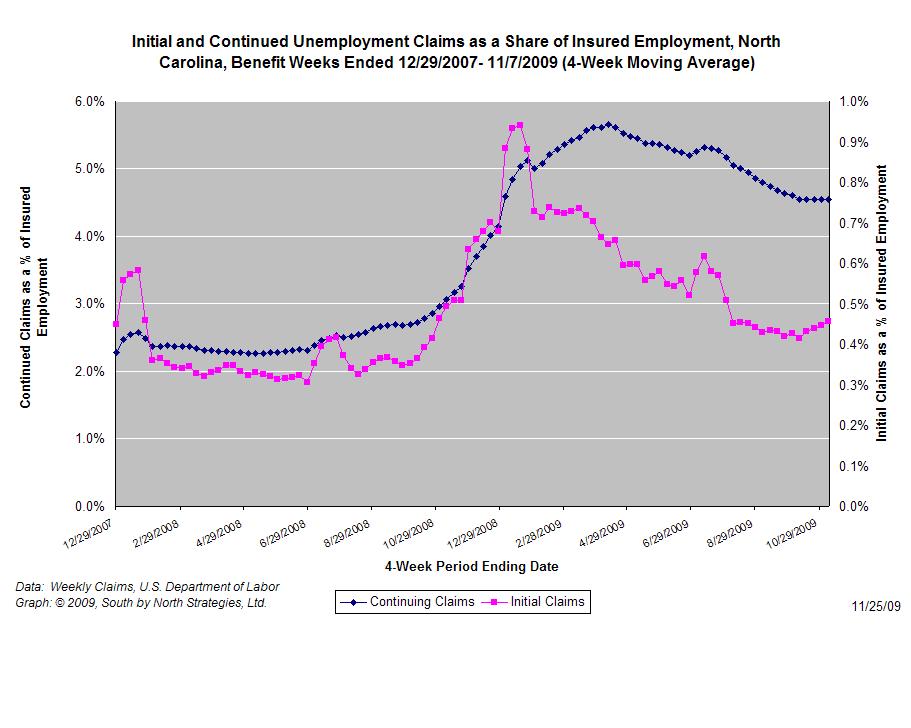
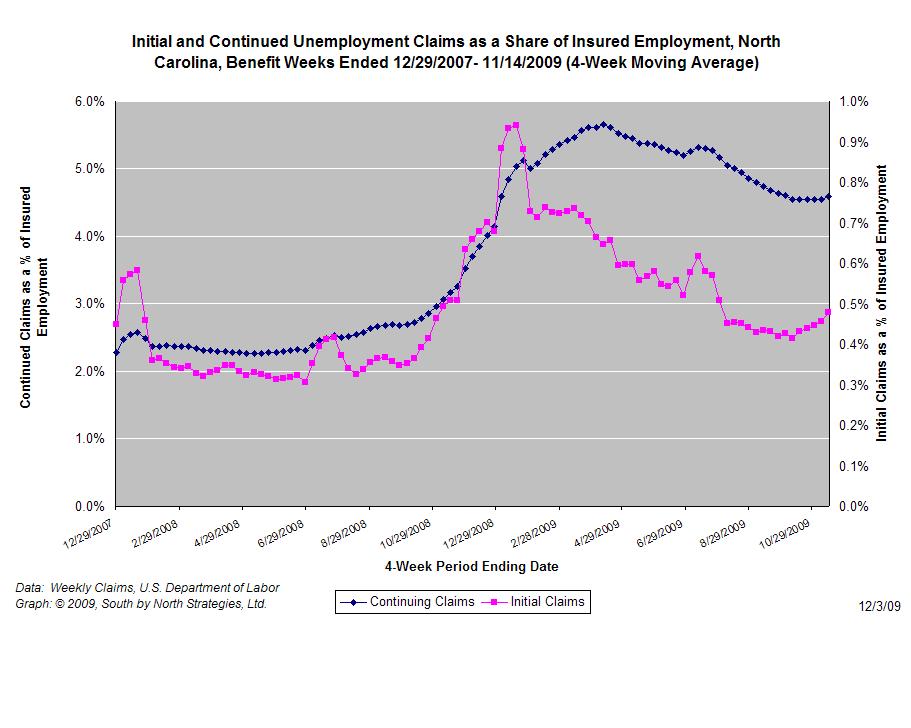
The graph (right) shows the changes in unemployment insurance claims (as a share of covered employment) in North Carolina since the recession’s start in December 2007.
Although new and continuing claims appear to have peaked for this business cycle, the claims levels remain elevated and point to a labor market that remains extremely weak. Especially troubling is the high level of continuing claims, which suggests that unemployed individuals are finding it extremely difficult to find new positions.
 Email Sign-Up
 RSS Feed