Policy Points
03.04.2014
Policy Points
For the benefit week ending on March 15, 2014, North Carolinians filed some 4,940 initial claims for state unemployment insurance benefits and 63,277 claims for state-funded continuing benefits. Compared to the prior week, there were fewer initial claims and fewer continuing claims. These figures come from data released by the US Department of Labor.
Averaging new and continuing claims over a four-week period — a process that helps adjust for seasonal fluctuations and better illustrates trends — shows that an average of 5,088 initial claims were filed over the previous four weeks, along with an average of 66,192 continuing claims. Compared to the previous four-week period, the average number of initial claims was lower, and the average number of continuing claims was lower.
One year ago, the four-week average for initial claims stood at 11,002, and the four-week average of continuing claims equaled 101,767.
In recent months covered employment has increased and now exceeds the level recorded a year ago (3.87 million versus 3.80 million). Nevertheless, there are still fewer covered workers than there were in January 2008, which means that payrolls are smaller today than they were some six years ago.
The graph (below right) shows the changes in unemployment insurance claims measured as a share of covered employment in North Carolina since the recession’s start in December 2007.
Both new and continuing claims have peaked for this cycle, and the four-week averages of new and continuing claims have fallen considerably. The four-week average of initial claims, when measured as a share of covered employment, is at the lowest level recorded since early 2008, while the four-week average of continuing claims now is at the lowest level recorded since early 2008.
Note that the recent declines in new and continuing claims are not necessarily indicative of an improving labor market. State legislation that took effect on July 1, 2013, made major changes to insurance eligibility criteria, and the more stringent criteria eliminate claims that would have been valid prior to July 1. In time, this development also should reduce the number of continuing claims. Additionally, the legislation reduced the maximum number of weeks of state-funded insurance for which a claimant is eligible — an action that eventually should lead to a reduction in the number of continuing claims.
To place the numbers in context, consider how the four-week average of initial claims (4,940) was 55.1 percent lower than the figure recorded one year ago (11,002), while the average number of continuing claims was 37.8 percent lower (63,277 versus 101,767). Given the modest rate of job growth that has occurred in North Carolina over the past year, such declines likely are products of changes to unemployment insurance laws rather than improvements in underlying economic conditions.
27.03.2014
Policy Points
For the benefit week ending on March 8, 2014, North Carolinians filed some 5,026 initial claims for state unemployment insurance benefits and 65,067 claims for state-funded continuing benefits. Compared to the prior week, there were fewer initial claims and fewer continuing claims. These figures come from data released by the US Department of Labor.
Averaging new and continuing claims over a four-week period — a process that helps adjust for seasonal fluctuations and better illustrates trends — shows that an average of 5,223 initial claims were filed over the previous four weeks, along with an average of 68,247 continuing claims. Compared to the previous four-week period, the average number of initial claims was lower, and the average number of continuing claims was lower.
One year ago, the four-week average for initial claims stood at 11,716, and the four-week average of continuing claims equaled 104,733.
In recent months covered employment has increased and now exceeds the level recorded a year ago (3.87 million versus 3.80 million). Nevertheless, there are still fewer covered workers than there were in January 2008, which means that payrolls are smaller today than they were some six years ago.
The graph (below right) shows the changes in unemployment insurance claims measured as a share of covered employment in North Carolina since the recession’s start in December 2007.
Both new and continuing claims have peaked for this cycle, and the four-week averages of new and continuing claims have fallen considerably. The four-week average of initial claims, when measured as a share of covered employment, is near the lowest level recorded since early 2008, while the four-week average of continuing claims now is at he lowest level recorded since early 2008.
Note that the recent declines in new and continuing claims are not necessarily indicative of an improving labor market. State legislation that took effect on July 1, 2013, made major changes to insurance eligibility criteria, and the more stringent criteria eliminate claims that would have been valid prior to July 1. In time, this development also should reduce the number of continuing claims. Additionally, the legislation reduced the maximum number of weeks of state-funded insurance for which a claimant is eligible — an action that eventually should lead to a reduction in the number of continuing claims.
To place the numbers in context, consider how the four-week average of initial claims (5,223) was 55.4 percent lower than the figure recorded one year ago (11,716), while the average number of continuing claims was 34.8 percent lower (68,247 versus 104,733). Given the modest rate of job growth that has occurred in North Carolina over the past year, such declines likely are products of changes to unemployment insurance laws rather than improvements in underlying economic conditions.
17.03.2014
News Releases, Policy Points
CHAPEL HILL, NC (March 17, 2014) – In January, employers in North Carolina eliminated 7,200 more payroll positions than they added (-0.2 percent), due almost equally to job losses in the private and public sectors (-3,700 and -3,500, respectively) The monthly household survey, however, recorded a drop in unemployment, with the statewide unemployment rate falling to 6.7 percent, which was the lowest monthly figure logged since August 2008.
These findings come from new data released today by the Labor and Economic Analysis Division of the NC Department of Commerce.
“The January employment report offers mixed messages about the health of North Carolina’s labor market,” said John Quinterno, a principal with South by North Strategies, Ltd., a research firm specializing in economic and social policy. “On the one hand, more people reported being employed in January compared to December. On the other hand, the number of payroll jobs in the state declined slightly, with losses occurring throughout the public and private sectors.”
Between December 2013 and January 2014, North Carolina employers shed 7,200 more jobs than they added (-0.2 percent). Private-sector payrolls lost, on net, 3,700 positions (-0.1 percent), and public-sector payrolls lost, on net, 3,500 jobs (-0.5 percent). Within private industry, the leisure and hospitality sector shed the most jobs (-5,600 jobs, or -1.3 percent, with all of the decline occurring in the accommodation and food service subsector), followed by the trade, transportation, and utilities sector (-5,300 jobs, or -0.7 percent, with all of the losses occurring in the retail trade subsector) and the professional and business services sector (-3,200 jobs, or -0.6 percent, with almost all of the decline occurring in the administrative and waste management subsector). With the seemingly anomalous exception of the construction sector, most other major industry groups recorded few changes in payroll levels between December and January.
A revision to the December payroll data found that the state gained 3,400 fewer jobs that month than first estimated (+7,700 versus +11,100). With that revision, North Carolina now has, on net, 71,000 fewer payroll positions (-1.7 percent) than it did in December 2007. Since bottoming out in February 2010, the state has netted an average of 5,485 payroll jobs per month, resulting in a cumulative gain of 257,800 positions (+6.7 percent). At that rate, holding all else equal, it would take until early 2015 for the state to have as many jobs as it did at the end of 2007.
“Revisions to the 2013 data reveal that North Carolina netted 21,100 more jobs over the course of the year than first reported,” noted Quinterno. “While positive growth always is welcome, the average monthly rate of job growth recorded in 2013—a rate of 0.2 percent—was identical to the average monthly rate of job growth logged in 2012. No matter how one parses the data, North Carolina has been experiencing extremely slow job growth for close to four years.”
The household data recorded in January offered a more positive view of the state’s labor market. Last month, the statewide unemployment rate fell by 0.2 percentage points to 6.7 percent, which was the lowest monthly rate recorded since August 2008, when the rate was 6.6 percent. Additionally, 17,407 more North Carolinians had jobs in January (+0.4 percent) than was in December, and 11,354 fewer persons were unemployed (-3.5 percent). And over the month, the size of the state’s labor force essentially held steady at 4.7 million.
While the household data for the month of January generally were positive, the data for the past year were less so, even after accounting for annual data revisions. The state’s unemployment rate fell by 2.1 percentage points over the course of 2013, but a sizable portion of the decline was attributable to a contraction in the size of the state’s labor force. Between January 2013 and January 2014, the number of unemployed North Carolinians fell by 105,656 persons (-25.3 percent). Approximately 57.1 percent of that decline resulted from a drop in the size of the labor force (-60,373 persons, -1.3 percent), while 42.9 percent resulted from an increase in employment (+45,283, +1.1 percent).
Declines in the statewide labor force participation rate provide additional evidence of a labor market that is under-performing. In January, the labor force participation rate held steady at the revised December 2013 figure of 61.1 percent. That rate was the lowest monthly figure recorded at any point since 1976. Moreover, the labor force participation rate fell steadily over the last year. Between January 2013 and January 2014, this important measure of labor utilization fell by 1.5 percentage points, dropping to 61.1 percent from 62.6 percent.
Although another important measure of labor utilization, the employment-to-population ratio, increased slightly between December and January, the current ratio of 57 percent is 0.1 percentage points lower than the corresponding figure logged in January 2013 and just 0.7 percentage points above the 38-year low of 56.3 percent posted in the summer of 2011.
January’s labor market report provided additional insight into the effects of the extensive changes to the state’s system of unemployment insurance implemented over the summer. Between December and January, the number of claimants of regular state-funded insurance fell by 1.7 percent, dropping to 59,878 from 60,889. Compared to a year earlier, 67,396 fewer individuals received regular state-funded insurance in January (-53 percent).
Also in January, the state paid a (nominal) total of $49.1 million in regular state-funded unemployment insurance compensation, an amount 58.3 percent lower than the (nominal) total of $117.7 million paid in January 2013.
“North Carolina’s labor market started 2014 the same way it ended 2013: mired in a painfully slow recovery that simply is not generating enough jobs, fast enough to accommodate all those who want and need work,” cautioned Quinterno. “In many ways, the state’s labor market began 2014 stuck in the same low gear where it has been for most of the past four years.”
13.03.2014
Policy Points
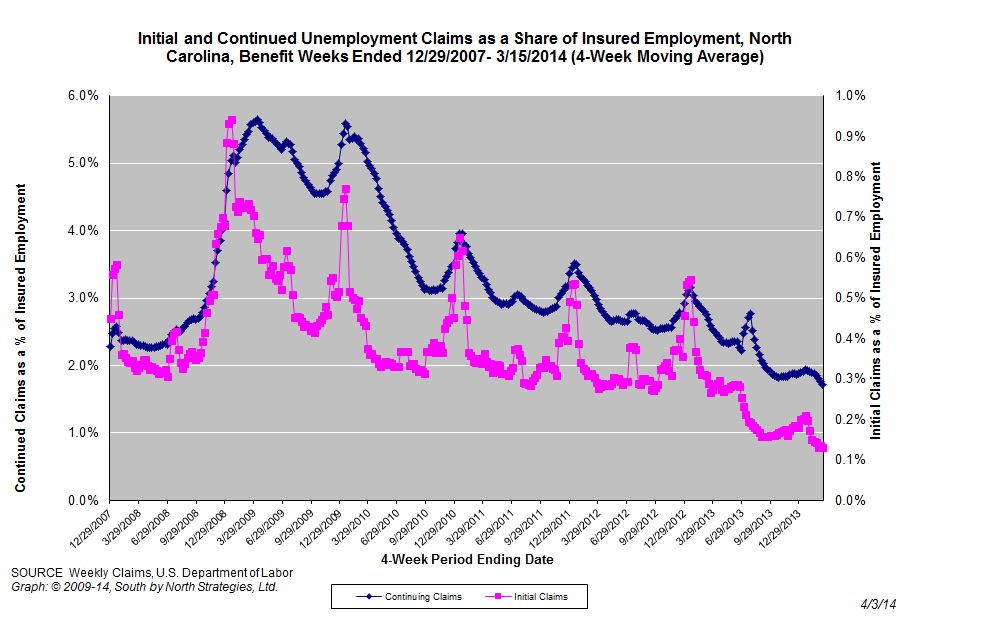
For the benefit week ending on February 22, 2014, North Carolinians filed some 5,333 initial claims for state unemployment insurance benefits and 69,600 claims for state-funded continuing benefits. Compared to the prior week, there were fewer initial claims and fewer continuing claims. These figures come from data released by the US Department of Labor.
Averaging new and continuing claims over a four-week period — a process that helps adjust for seasonal fluctuations and better illustrates trends — shows that an average of 5,562 initial claims were filed over the previous four weeks, along with an average of 71,672 continuing claims. Compared to the previous four-week period, the average number of initial claims was lower, and the average number of continuing claims was lower.
One year ago, the four-week average for initial claims stood at 11,854, and the four-week average of continuing claims equaled 108,016.
In recent months covered employment has increased and now exceeds the level recorded a year ago (3.87 million versus 3.80 million). Nevertheless, there are still fewer covered workers than there were in January 2008, which means that payrolls are smaller today than they were some six years ago.
The graph (below right) shows the changes in unemployment insurance claims measured as a share of covered employment in North Carolina since the recession’s start in December 2007.
Both new and continuing claims appear to have peaked for this cycle, and the four-week averages of new and continuing claims have fallen considerably, though the numbers have been fluctuating in recent weeks. That said, the four-week average of initial claims, when measured as a share of covered employment, is at the lowest level recorded since early 2008. The four-week average of continuing claims also has fallen toward the lowest level recorded since early 2008.
Note that the recent declines in new and continuing claims are not necessarily indicative of an improving labor market. State legislation that took effect on July 1, 2013, made major changes to insurance eligibility criteria, and the more stringent criteria eliminate claims that would have been valid prior to July 1. In time, this development also should reduce the number of continuing claims. Additionally, the legislation reduced the maximum number of weeks of state-funded insurance for which a claimant is eligible — an action that eventually should lead to a reduction in the number of continuing claims.
To place the numbers in context, consider how the four-week average of initial claims (5,562) was 53.1 percent lower than the figure recorded one year ago (11,854), while the average number of continuing claims was 33.6 percent lower (71,672 versus 108,016). Given the modest rate of job growth that has occurred in North Carolina over the past year, such declines likely are products of changes to unemployment insurance laws rather than improvements in underlying economic conditions.
06.03.2014
Policy Points
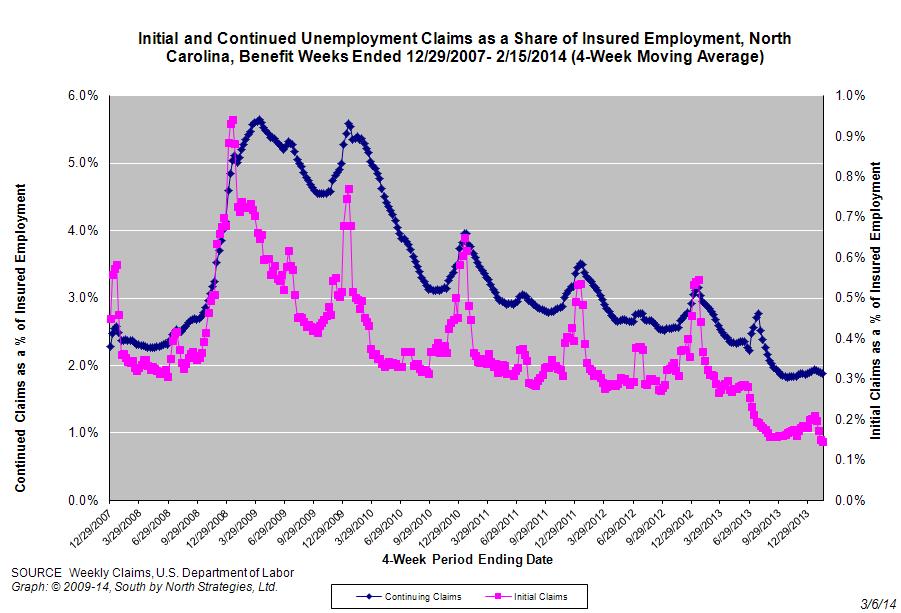
For the benefit week ending on February 15, 2014, North Carolinians filed some 5,482 initial claims for state unemployment insurance benefits and 71,497 claims for state-funded continuing benefits. Compared to the prior week, there were more initial claims and more continuing claims. These figures come from data released by the US Department of Labor.
Averaging new and continuing claims over a four-week period — a process that helps adjust for seasonal fluctuations and better illustrates trends — shows that an average of 5,651 initial claims were filed over the previous four weeks, along with an average of 72,516 continuing claims. Compared to the previous four-week period, the average number of initial claims was lower, and the average number of continuing claims was lower.
One year ago, the four-week average for initial claims stood at 12,304, and the four-week average of continuing claims equaled 109,498.
In recent months covered employment has increased and now exceeds the level recorded a year ago (3.87 million versus 3.80 million). Nevertheless, there are still fewer covered workers than there were in January 2008, which means that payrolls are smaller today than they were six years ago.
The graph (below right) shows the changes in unemployment insurance claims measured as a share of covered employment in North Carolina since the recession’s start in December 2007.
Both new and continuing claims appear to have peaked for this cycle, and the four-week averages of new and continuing claims have fallen considerably, though the numbers have been fluctuating in recent weeks. That said, the four-week average of initial claims, when measured as a share of covered employment, is at the lowest level recorded since early 2008. The four-week average of continuing claims also has fallen toward the lowest level recorded since early 2008.
Note that the recent declines in new and continuing claims are not necessarily indicative of an improving labor market. State legislation that took effect on July 1, 2013, made major changes to insurance eligibility criteria, and the more stringent criteria eliminate claims that would have been valid prior to July 1. In time, this development also should reduce the number of continuing claims. Additionally, the legislation reduced the maximum number of weeks of state-funded insurance for which a claimant is eligible — an action that eventually should lead to a reduction in the number of continuing claims.
To place the numbers in context, consider how the four-week average of initial claims (5,651) was 54.1 percent lower than the figure recorded one year ago (12,304), while the average number of continuing claims was 33.8 percent lower (72,516 versus 109,498). Given the modest rate of job growth that has occurred in North Carolina over the past year, such declines likely are products of changes to unemployment insurance laws rather than improvements in underlying economic conditions.


 Email Sign-Up