Policy Points
05.02.2014
News Releases, Policy Points
CHAPEL HILL, NC (February 5, 2014) – Between December 2012 and December 2013, unemployment rates fell in all 100 of North Carolina’s counties and in all 14 of the state’s metropolitan areas. Over the same period, however, the number of people who reported having jobs actually decreased in 42 counties and 6 metro areas. That suggests that drops in unemployment were intertwined with the exiting of people from the labor force; in fact, the size of the labor force decreased in in 92 counties and in 14 metro areas over the year.
These findings come from new estimates released by the Labor and Economic Analysis Division of the North Carolina Department of Commerce.
“Local unemployment rates fell across all of North Carolina over the past year, with the statewide rate falling by 2.8 percentage points,” said John Quinterno, a principal with South by North Strategies, Ltd., a research firm specializing in economic and social policy. “Many counties and metros now are experiencing some of the lowest unemployment rates recorded since the onset of the ‘Great Recession’ in December 2007.”
“We can’t lose sight of the fact that local unemployment rates across North Carolina remain elevated,” added Quinterno. “In December, 99 counties and 14 metro areas posted unemployment rates greater than those logged six years ago.”
Compared to December 2007, which is when the national economy fell into recession, North Carolina now has 1.7 percent fewer payroll jobs (-71,200). In December, the state added 11,100 more jobs than it lost (+0.3 percent). Since bottoming out in February 2010, the state’s labor market has netted some 5,578 jobs per month, resulting in a cumulative gain of 256,600 positions (+6.7 percent). At that rate, all else equal, it would take until early 2015 for the state to have as many payroll jobs as it did at the end of 2007.
Between November 2013 and December 2013, local unemployment rates decreased in 86 of the state’s 100 counties, rose in 11 counties, and held constant in 3 counties. Individual county rates in December ranged from 4.1 percent in Orange County to 12.6 percent in Scotland County. Overall, 5 counties posted unemployment rates greater than or equal to 10 percent, and 58 counties posted rates between 6.7 and 9.9 percent.
“Non-metropolitan labor markets still are struggling relative to metropolitan ones,” noted Quinterno. “In December, 7.5 percent of the non-metro labor force was unemployed, compared to 6.3 percent of the metro labor force. Compared to December 2007, the non-metro labor force now has 5.5 percent fewer employed persons, while the number of unemployed individuals is 30.6 percent larger. Over that time, the size of the rural labor force has fallen by 3.5 percent.”
Between November and December, unemployment rates fell in all 14 of the state’s metro areas. Rocky Mount had the highest unemployment rate (9.4 percent), followed by Fayetteville (7.8 percent) and Hickory-Morganton-Lenoir (7.2 percent). Durham-Chapel Hill had the lowest unemployment rate (4.9 percent), followed by Asheville (5 percent) and Raleigh-Cary (5.2 percent).
Compared to December 2012, unemployment rates in December 2013 were lower in all 100 counties and all 14 metro areas. Over the year, however, labor force sizes decreased in 92 counties and in 14 metros. In fact, the statewide labor force was 2.3 percent smaller (-111,164 individuals) in December 2013 than it was in December 2012.
Among metros, Rocky Mount’s labor force contracted at the greatest rate (-5.3 percent), followed by Hickory-Morganton-Lenoir (-4.2 percent) and Burlington (-3.3 percent). With those changes, metro areas now are home to 72 percent of the state’s labor force, with 50.8 percent of the labor force residing in the Triangle, Triad, and Charlotte metros.
In the long term, improvements in overall labor market conditions depend on growth in the Charlotte, Research Triangle, and Piedmont Triad regions. Yet growth in these metros remains muted. Collectively, employment in the three metro regions has risen by 4.2 percent since December 2007, and the combined unemployment rate in December totaled 6 percent. Of the three broad regions, the Research Triangle had the lowest December unemployment rate (5.2 percent), followed by the Piedmont Triad (6.6 percent) and Charlotte (6.7 percent).
The local employment report for December also provides insights into the effects of the extensive changes to the state’s system of unemployment insurance implemented over the summer. Last month, the number of regular unemployment insurance initial claims filed in North Carolina totaled 33,157, down from the 62,681 initial claims filed a year earlier (-47.3 percent).
Mecklenburg County was home to greatest number of regular initial claims (3,079), followed by Wake (2,066), Guilford (1,889), Forsyth (1,029), and Cumberland (1,024) counties.
In December 2013, North Carolinians received a (nominal) total of $62.2 million in regular state-funded and federal unemployment insurance compensation, down from the (nominal) $237.3 million received in December 2012. This sharp decline (-73.8 percent) is attributable to a mix of factors, such as drops in the number of insurance claims resulting from economic improvements and legal changes to eligibility criteria.
Additionally, the state’s decision to exit the federal Emergency Unemployment Compensation (EUC) program reduced the amount of federal unemployment insurance compensation flowing into the state in December. Between December 2012 and December 2013, the amount of federal unemployment insurance benefits paid to North Carolinians fell by 97.5 percent, dropping to a (nominal) total of $3.1 million from a (nominal) total of $121.8 million.
“Despite recent declines in local unemployment rates, 2013 proved to be another weak year for local labor markets across North Carolina,” said Quinterno. “The fundamental problem facing the state is the same one that has troubled it for the past four years: a sluggish recovery that is not generating enough employment opportunities for all those who want and need them.”
30.01.2014
Policy Points
For the benefit week ending on January 11, 2014, North Carolinians filed some 8,097 initial claims for state unemployment insurance benefits and 74,902 claims for state-funded continuing benefits. Compared to the prior week, there were fewer initial claims and fewer continuing claims. These figures come from data released by the US Department of Labor.
Averaging new and continuing claims over a four-week period — a process that helps adjust for seasonal fluctuations and better illustrates trends — shows that an average of 7,843 initial claims were filed over the previous four weeks, along with an average of 73,589 continuing claims. Compared to the previous four-week period, the average number of initial claims was higher, and the average number of continuing claims was higher.
One year ago, the four-week average for initial claims stood at 20,479, and the four-week average of continuing claims equaled 118,156.
In recent months covered employment has increased and now exceeds the level recorded a year ago (3.86 million versus 3.79 million). Nevertheless, there are still fewer covered workers than there were in January 2008, which means that payrolls are smaller today than they were six years ago.
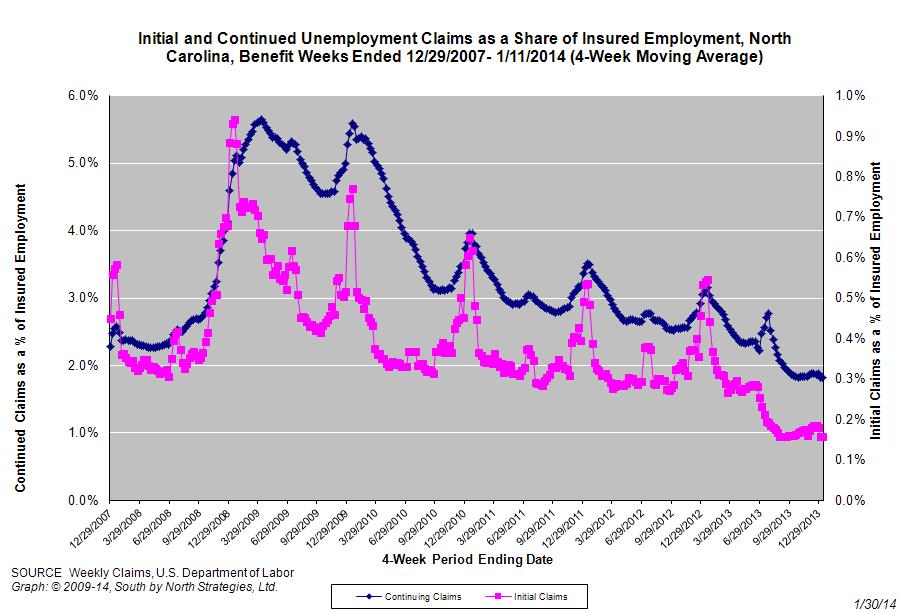
The graph (below right) shows the changes in unemployment insurance claims measured as a share of covered employment in North Carolina since the recession’s start in December 2007.
Both new and continuing claims appear to have peaked for this cycle, and the four-week averages of new and continuing claims have fallen considerably, though the numbers have been fluctuating in recent weeks. That said, the four-week average of initial claims, when measured as a share of covered employment, is close to the lowest level recorded since early 2008. The four-week average of continuing claims also has fallen toward the lowest level recorded since early 2008.
Note that the recent declines in new and continuing claims are not necessarily indicative of an improving labor market. State legislation that took effect on July 1, 2013, made major changes to insurance eligibility criteria, and the more stringent criteria eliminate claims that would have been valid prior to July 1. In time, this development also should reduce the number of continuing claims. Additionally, the legislation reduced the maximum number of weeks of state-funded insurance for which a claimant is eligible — an action that eventually should lead to a reduction in the number of continuing claims.
To place the numbers in context, consider how the four-week average of initial claims (7,843) was 61.7 percent lower than the figure recorded one year ago (20,479), while the average number of continuing claims was 37.7 percent lower (73,589 versus 118,156). Given the modest rate of job growth that has occurred in North Carolina over the past year, such declines likely are products of changes to unemployment insurance laws rather than improvements in underlying economic conditions.
28.01.2014
News Releases, Policy Points
CHAPEL HILL, NC (January 28, 2014) – Over the course of 2013, employers in North Carolina added 64,500 more payroll jobs than they cut (+1.6 percent), due entirely to hiring in the private sector. Yet both the absolute number of jobs added in 2013 and the rate of job growth recorded over the year were below the corresponding values logged in 2012 (+89,900 jobs, +2.3 percent). Put differently, 2013 saw little deviation from the pattern of anemic job growth that has troubled the state since the onset of the labor market recovery in early 2010.
These findings come from new data released today by the Labor and Economic Analysis Division of the NC Department of Commerce.
“The December jobs report offered mixed news about job growth in North Carolina,” said John Quinterno, a principal with South by North Strategies, Ltd., a research firm specializing in economic and social policy. “On the one hand, job growth turned positive again in December, and as a result, the year’s final quarter proved to be its best one for job growth. On the other hand, North Carolina netted fewer jobs over the course of 2013 than it did in 2012.”
Between November and December of 2013, North Carolina businesses added 11,100 more jobs than they eliminated (+0.3 percent). Private-sector payrolls netted 10,600 positions (+0.3 percent), and public-sector payrolls netted 500 jobs (+0.1 percent). Within private industry, the trade, transportation, and utilities sector netted the most jobs (+4,500 jobs, or +0.6 percent, with 84.4 percent of the gain occurring in the retail trade subsector), followed by the other services (+2,100 jobs, or +1.5 percent) and finance sectors (+1,900 jobs, or +0.9 percent).
A revision to the November payroll data found that the state lost 1,600 fewer jobs that month than first estimated (-4,900 versus -6,500). With that revision, North Carolina now has, on net, 71,200 fewer payroll positions (-1.7 percent) than it did in December 2007. Since bottoming out in February 2010, the state has netted an average of 5,578 payroll jobs per month, resulting in a cumulative gain of 256,600 positions (+6.7 percent). At that rate, all else equal, it would take until early 2015 for the state to have as many jobs as it did at the end of 2007.
“Over the course of 2013, North Carolina netted jobs, on average, at a rate of 0.1 percent per month,” noted Quinterno. “In 2012, the state gained jobs, on average, at a rate of 0.2 percent per month, and in both 2010 and 2011, the comparable average rate of growth was 0.1 percent per month. While positive growth always is welcome, the state’s labor market has experienced the same basic pattern of slow job growth for the past four years.”
At first glance, the household data recorded in December offered a positive view of the state’s labor market. Last month, the statewide unemployment rate fell by 0.5 percentage points to 6.9 percent, which was the lowest monthly rate recorded since September 2008, when the rate also was 6.9 percent. Additionally, 19,217 more North Carolinians had jobs in December (+0.4 percent) than was the case in November, and 21,097 fewer persons were unemployed (-6.1 percent). And over the month, the size of the state’s labor force essentially held steady at 4.7 million.
While the household data for the month of December generally were positive, the data for the year as a whole were not. The state’s unemployment rate fell by 2.5 percentage points over the course of 2013, but most of the decline originated in a contraction in the size of the state’s labor force. Between December 2012 and December 2013, the number of employed North Carolinians rose by just 13,414 persons (+0.3 percent), yet the number of unemployed North Carolinians fell by 124,344 persons (-27.8 percent). The remaining 110,930 individuals left the labor force entirely, meaning that North Carolina ended 2013 with a labor force that was 2.3 percent smaller than was the case a year earlier. In fact, North Carolina’s labor force now is approximately as large as it was in the middle of 2011.
Declines in the statewide labor force participation rate provide additional evidence of a labor market that underperformed in 2013. In December, the labor force participation rate fell to 61.2 percent, which was the lowest monthly figure recorded at any point since 1976. In fact, the labor force participation rate fell steadily during 2013. Over the year, that important measure of labor utilization fell by 2.1 percentage points, dropping to 61.2 percent from 63.3 percent.
Although another important measure of labor utilization, the employment-to-population ratio, increased between November and December, the current ratio of 57 percent is 0.4 percentage points lower than the corresponding figure logged in December 2012 and just 0.7 percentage points above the 37-year low of 56.3 percent posted in the summer of 2011.
December’s labor market report provided additional insight into the effects of the extensive changes to the state’s system of unemployment insurance implemented over the summer. Between November and December, the number of claimants of regular state-funded insurance increased by 4.2 percent, rising to 60,889 from 58,432. Compared to a year earlier, however, 49,942 fewer individuals received regular state-funded insurance in December (-45.1 percent).
Also in December, the state paid a (nominal) total of $59.1 million in regular state-funded unemployment insurance compensation, an amount 48.8 percent lower than the (nominal) total of $115.5 million paid in December 2012.
“The sizable drop in the state’s unemployment rate in December does not alter the fact that 2013 was yet another underwhelming year for North Carolina’s labor market,” observed Quinterno. “Job growth lagged behind the pace recorded in 2012 and was consistent with the uninspiring performance of the past four years. While the unemployment rate did fall sharply over the course of 2013, the number of employed persons barely changed, meaning that unemployment fell due to people leaving the labor market altogether rather than finding work.”
“None of 2013 data suggest that North Carolina’s labor market has turned a corner and has moved onto a more robust, more sustainable trajectory.”
23.01.2014
Policy Points
For the benefit week ending on January 4, 2014, North Carolinians filed some 10,656 initial claims for state unemployment insurance benefits and 76,518 claims for state-funded continuing benefits. Compared to the prior week, there were more initial claims and more continuing claims. These figures come from data released by the US Department of Labor.
Averaging new and continuing claims over a four-week period — a process that helps adjust for seasonal fluctuations and better illustrates trends — shows that an average of 7,731 initial claims were filed over the previous four weeks, along with an average of 72,891 continuing claims. Compared to the previous four-week period, the average number of initial claims was higher, and the average number of continuing claims was higher.
One year ago, the four-week average for initial claims stood at 20,210, and the four-week average of continuing claims equaled 115,748.
In recent months covered employment has increased and now exceeds the level recorded a year ago (3.86 million versus 3.79 million). Nevertheless, there are still fewer covered workers than there were in January 2008, which means that payrolls are smaller today than they were six years ago.
The graph (below right) shows the changes in unemployment insurance claims measured as a share of covered employment in North Carolina since the recession’s start in December 2007.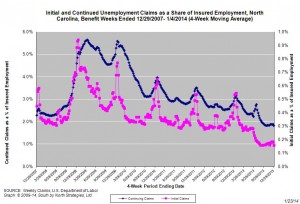
Both new and continuing claims appear to have peaked for this cycle, and the four-week averages of new and continuing claims have fallen considerably, though the numbers have been fluctuating in recent weeks. That said, the four-week average of initial claims, when measured as a share of covered employment, is close to the lowest level recorded since early 2008. The four-week average of continuing claims also has fallen toward the lowest level recorded since early 2008.
Note that the recent declines in new and continuing claims are not necessarily indicative of an improving labor market. State legislation that took effect on July 1, 2013, made major changes to insurance eligibility criteria, and the more stringent criteria eliminate claims that would have been valid prior to July 1. In time, this development also should reduce the number of continuing claims. Additionally, the legislation reduced the maximum number of weeks of state-funded insurance for which a claimant is eligible — an action that eventually should lead to a reduction in the number of continuing claims.
To place the numbers in context, consider how the four-week average of initial claims (7,731) was 61.7 percent lower than the figure recorded one year ago (20,210), while the average number of continuing claims was 37 percent lower (72,891 versus 115,748). Given the modest rate of job growth that has occurred in North Carolina over the past year, such declines likely are products of changes to unemployment insurance laws rather than improvements in underlying economic conditions.
16.01.2014
Policy Points
For the benefit week ending on December 28, 2014, North Carolinians filed some 7,664 initial claims for state unemployment insurance benefits and 75,731 claims for state-funded continuing benefits. Compared to the prior week, there were more initial claims and more continuing claims. These figures come from data released by the US Department of Labor.
Averaging new and continuing claims over a four-week period — a process that helps adjust for seasonal fluctuations and better illustrates trends — shows that an average of 6,917 initial claims were filed over the previous four weeks, along with an average of 72,427 continuing claims. Compared to the previous four-week period, the average number of initial claims was lower, and the average number of continuing claims was higher.
One year ago, the four-week average for initial claims stood at 17,270, and the four-week average of continuing claims equaled 110,469.
In recent months covered employment has increased and now exceeds the level recorded a year ago (3.85 million versus 3.78 million). Nevertheless, there are still fewer covered workers than there were in January 2008, which means that payrolls are smaller today than they were almost six years ago.
The graph (below right) shows the changes in unemployment insurance claims measured as a share of covered employment in North Carolina since the recession’s start in December 2007.
Both new and continuing claims appear to have peaked for this cycle, and the four-week averages of new and continuing claims have fallen considerably, though the numbers have been fluctuating in recent weeks. That said, the four-week average of initial claims, when measured as a share of covered employment, is close to the lowest level recorded since early 2008. The four-week average of continuing claims also has fallen toward the lowest level recorded since early 2008.
Note that the recent declines in new and continuing claims are not necessarily indicative of an improving labor market. State legislation that took effect on July 1, 2013, made major changes to insurance eligibility criteria, and the more stringent criteria eliminate claims that would have been valid prior to July 1. In time, this development also should reduce the number of continuing claims. Additionally, the legislation reduced the maximum number of weeks of state-funded insurance for which a claimant is eligible — an action that eventually should lead to a reduction in the number of continuing claims.
To place the numbers in context, consider how the four-week average of initial claims (6,917) was 59.9 percent lower than the figure recorded one year ago (17,270), while the average number of continuing claims was 34.4 percent lower (72,427 versus 110,469). Given the modest rate of job growth that has occurred in North Carolina over the past year, such declines likely are products of changes to unemployment insurance laws rather than improvements in underlying economic conditions.


 Email Sign-Up