Policy Points
10.01.2014
News Releases, Policy Points
CHAPEL HILL, NC (January 10, 2014) – The national labor market added in December just 74,000 (+0.1 percent) more jobs than it lost. While the unemployment rate and the number of unemployed persons fell last month, much of the decline was due to people exiting the labor market rather than finding work. Last month, the size of the labor force shrank by 347,000 individuals (-0.2 percent) and now is smaller than it was one year ago.
In December, 10.4 million Americans were unemployed (6.7 percent), while 7.8 million individuals worked part time despite preferring full-time positions. Another 917,000 individuals (not seasonally adjusted) were so discouraged about their job prospects that they had stopped searching for work altogether. Those persons were part of a larger population of 2.4 million Americans who were marginally attached to the labor force.
“December was the 39th-straight month of job growth recorded in the United States,” said John Quinterno, a principal with South by North Strategies, Ltd., a research firm specializing in economic and social policy. “Over the past year, the national economy netted an average of 182,000 jobs per month. Yet the country is still almost eight million jobs short of the number needed to replace the jobs lost since 2007 and to accommodate the subsequent growth in the size of the working-age population.”
In December, the nation’s employers added 74,000 more payroll positions than they cut (+0.1 percent). Gains occurred entirely in the private sector (+87,000), while government employers eliminated 13,000 more positions than they added, due mainly to cuts by local governments.
Furthermore, the payroll employment numbers for October and November underwent revisions; with the updates, the economy netted 441,000 jobs over those two months, not the 403,000 positions previously reported.
Within the private sector, payroll levels rose the most in the trade, transportation, and utilities sector (+69,000, with 80.1 percent of the gains occurring in the retail trade subsector), followed by the professional and business services sector (+19,000, with virtually all of the gain occurring in the administrative and waste services subsector), and the manufacturing sector (+9,000). Payroll levels in all other major sectors either declined (led by construction, -16,000) or were essentially unchanged from November.
“Since last December, the American economy has gained 2.2 million more payroll positions that it has lost,” noted Quinterno. “While the rate of growth had been accelerating in the months prior to December, the average monthly rate of job growth over the past year—some 182,000 positions per month—will not close the nation’s jobs gap anytime soon.”
Labor market conditions as measured by the household survey deteriorated in December. Last month, 10.4 million Americans (6.7 percent of the labor force) were jobless and seeking work. Both the unemployment rate and the total number of unemployed persons were lower than in the prior month. In December, the share of the population participating in the labor force fell to 62.8 percent, a rate lower than the one posted a year ago and one tied for the lowest rate logged in the past 35 years. This indicates that unemployment fell largely due to a contraction in the size of the labor force rather than an increase in employment.
Compared to a year ago, 1.4 million more Americans were working in December, and 1.9 million fewer persons were unemployed. At the same time, the share of the working-age population with a job (58.6 percent) remained at a depressed level.
Last month, the unemployment rate was higher among adult male workers than female ones (6.3 percent versus 6 percent). Unemployment rates were higher among Black (11.9 percent) and Hispanic workers (8.3 percent) than among white ones (5.9 percent). The unemployment rate among teenagers was 20.2 percent.
Moreover, 5.5 percent of all veterans were unemployed, and the rate among recent veterans (served after September 2001) was 7.3 percent. At the same time, 11.9 percent of Americans with disabilities were jobless and seeking work (not seasonally adjusted).
Jobs remained comparatively hard to find in December. Last month, the underemployment rate equaled 13.1 percent, down from the 14.4 percent rate logged a year ago. Not only were 10.4 million Americans unemployed, but 7.8 million individuals worked part-time jobs despite preferring full-time work. Another 917,000 individuals (not seasonally adjusted) were so discouraged about the labor market that they had stopped searching for work.
Among unemployed workers, 37.7 percent had been jobless for at least six months (compared to 39.1 percent a year earlier), and the average spell of unemployment equaled 37.1 weeks, down from an average duration of 38 weeks in December 2012.
In December, the leading cause of unemployment remained a job loss or the completion of a temporary job, which was the reason cited by 51.3 percent of unemployed persons. Another 29 percent of unemployed persons were re-entrants to the labor market, while 11.5 percent were new entrants. Voluntary job leavers accounted for the remaining 8.2 percent of the total.
“The December employment report offers evidence of an underperforming labor market,” observed Quinterno. “Last month, job growth slowed markedly and joblessness increased as a result of individuals abandoning the labor market altogether. The bottom line is that the American economy is not generating enough jobs for all those who want and need work.”
“Despite the passage of six years since the onset of the ‘Great Recession,’ the United States’ jobs crisis remains far from over.”
09.01.2014
Policy Points
For the benefit week ending on December 21, 2014, North Carolinians filed some 4,954 initial claims for state unemployment insurance benefits and 67,204 claims for state-funded continuing benefits. Compared to the prior week, there were fewer initial claims and fewer continuing claims. These figures come from data released by the US Department of Labor.
Averaging new and continuing claims over a four-week period — a process that helps adjust for seasonal fluctuations and better illustrates trends — shows that an average of 7,176 initial claims were filed over the previous four weeks, along with an average of 72,055 continuing claims. Compared to the previous four-week period, the average number of initial claims was higher, and the average number of continuing claims was lower.
One year ago, the four-week average for initial claims stood at 13,429, and the four-week average of continuing claims equaled 104,173.
In recent months covered employment has increased and now exceeds the level recorded a year ago (3.85 million versus 3.78 million). Nevertheless, there are still fewer covered workers than there were in January 2008, which means that payrolls are smaller today than they were almost six years ago.
The graph (below right) shows the changes in unemployment insurance claims measured as a share of covered employment in North Carolina since the recession’s start in December 2007.
Both new and continuing claims appear to have peaked for this cycle, and the four-week averages of new and continuing claims have fallen considerably, though the numbers have been trending upward in recent weeks. That said, the four-week average of initial claims, when measured as a share of covered employment, is close to the lowest level recorded since early 2008. The four-week average of continuing claims also has fallen to near the lowest level recorded since early 2008.
Note that the recent declines in new and continuing claims are not necessarily indicative of an improving labor market. State legislation that took effect on July 1, 2013, made major changes to insurance eligibility criteria, and the more stringent criteria eliminate claims that would have been valid prior to July 1. In time, this development also should reduce the number of continuing claims. Additionally, the legislation reduced the maximum number of weeks of state-funded insurance for which a claimant is eligible — an action that eventually should lead to a reduction in the number of continuing claims.
To place the numbers in context, consider how the four-week average of initial claims (7,176) was 46.6 percent lower than the figure recorded one year ago (13,429), while the average number of continuing claims was 30.8 percent lower (72,055 versus 104,173). Given the relative lack of improvement in labor market condition in North Carolina over the past year, such declines likely are products of changes to unemployment insurance laws rather than improvements in underlying economic conditions.
08.01.2014
News Releases, Policy Points
CHAPEL HILL, NC (January 8, 2014) – Today, South by North Strategies, Ltd. announces the worldwide release of Running the Numbers: A Practical Guide to Regional Economic and Social Analysis, a book written by John Quinterno, the firm’s founder, and published by M.E. Sharpe, Inc.
About the Book
Praised as a “book that is long overdue,” Running the Numbers demystifies data concepts, sources, and methods for public service professionals, university students, and citizens interested in understanding economic and social issues at the regional level. Through use of practical examples and a plainspoken narrative style, the book equips public administrators, urban planners, nonprofit executives, philanthropists, journalists, and graduate students in various disciplines to wield social and economic data for the benefit of their communities.
Running the Numbers explores a wide array of topics of regional importance, including economic output, demographics, industrial structure, labor markets, income, and deprivation, among many others. The book stresses practical applications, minimizes the use of math, and employs extended, chapter-length examples that demonstrate how analytical tools can illuminate the social and economic workings of actual regions within the United States.
A detailed listing of the book’s contents and a preview excerpt are available online.
Formats and Availability
Running the Numbers is available for purchase in paperback (ISBN: 9780765641052) and hardcover (ISBN: 9780765641045) editions in all global markets directly from the publisher or through such online and physical booksellers as Amazon.com (including many of its global sites) and Barnes & Noble. Click to view a selected list of retailers.
The list price of the paperback edition is USD $42.95, and the list price of the hardcover edition is USD $89.95. Prices vary outside of the United States.
Additionally, Running the Numbers is available as an e-book (ISBN: 9780765641083) that may be purchased from the publisher (web and iPad formats), the Google Play store (scanned pages), and other online retailers. The price is USD $24.95.
About the Author and Publisher
The author of Running the Numbers is John Quinterno, the founder and principal of South by North Strategies, Ltd., a research consultancy specializing in economic and social policy. Over the course of his career, Quinterno has directed multiple applied research projects into matters of labor economics, workforce development, regional policy, social insurance, and postsecondary education. A graduate of the University of Notre Dame and the University of North Carolina at Chapel Hill, Quinterno resides in Chapel Hill, NC.
The publisher of Running the Numbers is M.E. Sharpe, Inc., an award-winning independent publisher of books and journals in the social sciences and humanities, including titles in economics, business, political science, management, public administration, and history. The firm is located in Armonk, NY.
Advance Praise
“Running the Numbers is a book that is long overdue. Whether you’re a journalist, a planner or policy analyst, or a student looking to enter one of these fields, this book offers lucid, easy-to-read overviews of important data concepts and sources-a true resource!”
– Greg Schrock, Toulan School of Urban Studies & Planning, Portland State University
“What a gift. By delivering on its promise to demystify economic and social analysis, Running the Numbers provides powerful insights on regional data for practitioners and students of economic development.”
– Anita Brown-Graham, Institute for Emerging Issues, North Carolina State University
Inquiries
Please direct questions about the book’s contents and inquires about speaking and training engagements to the author at johnq[at]sbnstrategies.com or (919) 622-2392.
Please direct questions about sales and availability to M.E. Sharpe at custserv[at]mesharpe.com or 1-800-541-6563, x148.
College and university instructors interested in examining a copy of the book for potential classroom use should contact M.E. Sharpe online or at 1-800-541-6563, x151.
Media outlets and professional journals interested in copies for use in published reviews should contact M.E. Sharpe at custserv[at]mesharpe.com or 1-800-541-6563.
07.01.2014
News Releases, Policy Points
CHAPEL HILL, NC (January 7, 2014) – Between November 2012 and November 2013, unemployment rates fell in all 100 of North Carolina’s counties and in all 14 of the state’s metropolitan areas. Yet over the same period, the size of the labor force decreased in 92 counties and in 13 metro areas.
These findings come from new estimates released by the Labor and Economic Analysis Division of the North Carolina Department of Commerce.
“Unemployment rates across much of North Carolina have trended downward over the past year, with the statewide rate falling by 2.2 percentage points,” said John Quinterno, a principal with South by North Strategies, Ltd., a research firm specializing in economic and social policy.
“Many communities now are seeing some of the lowest unemployment rates recorded since the onset of the ‘Great Recession’ in late 2007,” added Quinterno. “Local unemployment rates nevertheless remain elevated, with 99 counties and 14 metro areas posting unemployment rates greater than those logged at the end of 2007.”
Compared to December 2007, which is when the national economy fell into recession, North Carolina now has 2 percent fewer payroll jobs (-83,900). In November, the state lost 6,500 more jobs than it gained (-0.2 percent). Since bottoming out in February 2010, the state’s labor market has netted some 5,420 jobs per month, resulting in a cumulative gain of 243,900 positions (+6.4 percent).
Between October 2013 and November 2013, local unemployment rates decreased in 91 of the state’s 100 counties and rose in 9 counties. Individual county rates in November ranged from 4.3 percent in Orange County to 13.5 percent in Scotland County. Overall, 6 counties posted unemployment rates greater than or equal to 10 percent, and 57 counties posted rates between 7 and 9.9 percent.
“Non-metropolitan labor markets still are struggling relative to metropolitan ones,” noted Quinterno. “In November, 7.8 percent of the non-metro labor force was unemployed, compared to 6.6 percent of the metro labor force. Compared to December 2007, the non-metro labor force now has 5 percent fewer employed persons, while the number of unemployed individuals is 37.2 percent larger.”
Between October and November, unemployment rates fell in all 14 of the state’s metro areas. Rocky Mount had the highest November unemployment rate (10 percent), followed by Fayetteville (8.1 percent) and Hickory-Morganton-Lenoir (7.6 percent). Durham-Chapel Hill had the lowest unemployment rate (5.1 percent), followed by Asheville (5.2 percent) and Raleigh-Cary (5.4 percent).
Compared to November 2012, unemployment rates in November 2013 were lower in all 100 counties and all 14 metro areas. Over the year, however, labor force sizes decreased in 92 counties and in 13 metros. In fact, the statewide labor force was 1.9 percent smaller (-88,254 individuals) in November 2013 than it was in November 2012.
Among metros, Rocky Mount’s labor force contracted at the greatest rate (-5 percent), followed by Hickory-Morganton-Lenoir (-3.1 percent) and Burlington and Jacksonville (both -2.4 percent). With those changes, metro areas now are home to 72 percent of the state’s labor force, with 50.8 percent of the labor force residing in the Triangle, Triad, and Charlotte metros.
In the long term, improvements in overall labor market conditions depend on growth in the Charlotte, Research Triangle, and Piedmont Triad regions. Yet growth in these metros remains muted. Collectively, employment in the three metro regions has risen by 5.1 percent since December 2007, and the combined unemployment rate in November totaled 6.3 percent. Of the three broad regions, the Research Triangle had the lowest November unemployment rate (5.5 percent), followed by the Piedmont Triad (6.9 percent) and Charlotte (7 percent).
The local employment report for November also provides insights into the effects of the extensive changes to the state’s system of unemployment insurance implemented over the summer. Last month, the number of regular unemployment insurance initial claims filed in North Carolina totaled 26,273, down from the 60,805 initial claims filed a year earlier (-56.8 percent).
Mecklenburg County was home to greatest number of regular initial claims (2,551), followed by Wake (2,095), Guilford (1,253), Cumberland (840), and Forsyth (761) counties.
In November 2013, North Carolinians received a (nominal) total of $55.7 million in regular state-funded and federal unemployment insurance compensation, down from the (nominal) $200.7 million received in November 2012. This sharp decline (-72.2 percent) is attributable to a mix of factors, such as drops in the number of insurance claims resulting from economic improvements and legal changes to eligibility criteria.
Additionally, the state’s decision to exit the federal Emergency Unemployment Compensation (EUC) program reduced the amount of federal unemployment insurance compensation flowing into the state in November. Between November 20102 and November 2013, the amount of federal unemployment insurance benefits paid to North Carolinians fell by 97.1 percent, dropping to a (nominal) total of $3.1 million from a (nominal) total of $106 million.
“Despite recent declines in local unemployment rates, labor market conditions remain weak across much of North Carolina,” said Quinterno. “The declines in local unemployment rates actually are obscuring a number of alarming developments—developments that are consistent with an under-performing economy.”
02.01.2014
Policy Points
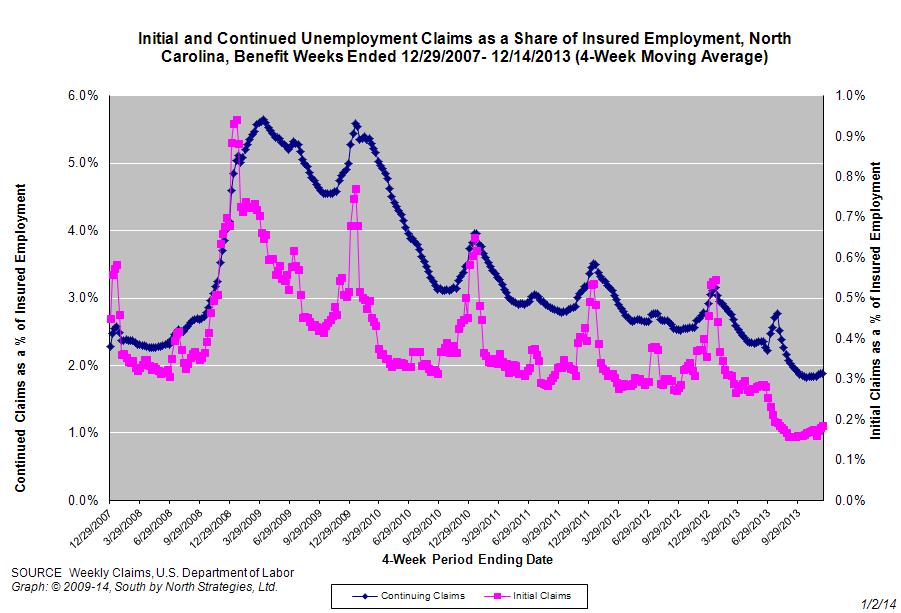
For the benefit week ending on December 14, 2014, North Carolinians filed some 7,648 initial claims for state unemployment insurance benefits and 72,109 claims for state-funded continuing benefits. Compared to the prior week, there were more initial claims and fewer continuing claims. These figures come from data released by the US Department of Labor.
Averaging new and continuing claims over a four-week period — a process that helps adjust for seasonal fluctuations and better illustrates trends — shows that an average of 7,108 initial claims were filed over the previous four weeks, along with an average of 72,631 continuing claims. Compared to the previous four-week period, the average number of initial claims was higher, and the average number of continuing claims was higher.
One year ago, the four-week average for initial claims stood at 15,131, and the four-week average of continuing claims equaled 105,233.
In recent months covered employment has increased and now exceeds the level recorded a year ago (3.85 million versus 3.78 million). Nevertheless, there are still fewer covered workers than there were in January 2008, which means that payrolls are smaller today than they were almost six years ago.
The graph (below right) shows the changes in unemployment insurance claims measured as a share of covered employment in North Carolina since the recession’s start in December 2007.
Both new and continuing claims appear to have peaked for this cycle, and the four-week averages of new and continuing claims have fallen considerably, though the numbers have been trending upward in recent weeks. That said, the four-week average of initial claims, when measured as a share of covered employment, is close to the lowest level recorded since early 2008. The four-week average of continuing claims also has fallen to near the lowest level recorded since early 2008.
Note that the recent declines in new and continuing claims are not necessarily indicative of an improving labor market. State legislation that took effect on July 1, 2013, made major changes to insurance eligibility criteria, and the more stringent criteria eliminate claims that would have been valid prior to July 1. In time, this development also should reduce the number of continuing claims. Additionally, the legislation reduced the maximum number of weeks of state-funded insurance for which a claimant is eligible — an action that eventually should lead to a reduction in the number of continuing claims.
To place the numbers in context, consider how the four-week average of initial claims (7,108) was 53 percent lower than the figure recorded one year ago (15,131), while the average number of continuing claims was 31 percent lower (72,631 versus 105,233). Given the relative lack of improvement in labor market condition in North Carolina over the past year, such declines likely are products of changes to unemployment insurance laws rather than improvements in underlying economic conditions.


 Email Sign-Up