Policy Points
03.07.2013
Policy Points
For the benefit week ending on June 8, 2013, some 11,977 North Carolinians filed initial claims for state unemployment insurance benefits and 90,437 individuals applied for state-funded continuing benefits. Compared to the prior week, there were more initial claims but fewer continuing claims. These figures come from data released by the US Department of Labor.
Averaging new and continuing claims over a four-week period — a process that helps adjust for seasonal fluctuations and better illustrates trends — shows that an average of 10,915 initial claims were filed over the previous four weeks, along with an average of 89,907 continuing claims. Compared to the previous four-week period, the average number of initial claims was higher, and the average number of continuing claims was higher.
One year ago, the four-week average for initial claims stood at 11,035, and the four-week average of continuing claims equaled 100,098.
In recent months covered employment has increased and now exceeds the level recorded a year ago (3.82 million versus 3.76 million). Nevertheless, there are still fewer covered workers than there were in January 2008, which means that payrolls are smaller today than they were 5.5 years ago.
The graph shows the changes in unemployment insurance claims measured as a share of covered employment in North Carolina since the recession’s start in December 2007. 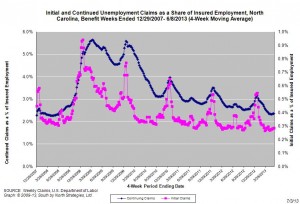
Both new and continuing claims appear to have peaked for this cycle, and the four-week averages of new and continuing claims have fallen considerably. In fact, the four-week average of initial claims, when measured as a share of covered employment, is now at the lowest level recorded since early 2008. Yet continuing claims remain at an elevated level, which suggests that unemployed individuals are finding it difficult to find new positions.
02.07.2013
News Releases, Policy Points
CHAPEL HILL, NC (July 2, 2013) – Between May 2012 and May 2013, unemployment rates fell in 71 of North Carolina’s 100 countries and in 11 of the state’s 14 metropolitan areas. Over the period, the size of the labor force grew in 38 counties and in 9 metro areas. These findings come from new estimates prepared by the Labor and Economic Analysis Division of the North Carolina Department of Commerce.
“Local unemployment rates fell throughout North Carolina over the course of the year,” said John Quinterno, a principal with South by North Strategies, Ltd., a research firm specializing in economic and social policy. “Unemployment nevertheless remains elevated, with 41 counties and 2 metro areas posting unemployment rates of at least 10 percent. In May 2008, in contrast, just one county and no metro areas logged unemployment rates of at least 10 percent.”
Compared to December 2007, which is when the national economy fell into recession, North Carolina now has 3 percent fewer jobs (-126,100) and has seen its unadjusted unemployment rate climb to 8.9 percent from 4.7 percent. In May, the state lost 5,900 more jobs than it added (- 0.1 percent). Since bottoming out in February 2010, the state’s labor market has netted some 5,172 jobs per month, resulting in a cumulative gain of 201,700 positions (+5.3 percent).
Between April 2013 and May 2013, local unemployment rates increased in 87 of the state’s 100 counties. Individual county rates ranged from 5.7 percent in Currituck County to 16.2 percent in Scotland County. Overall, 41 counties posted unemployment rates greater than or equal to 10 percent, and 53 counties posted rates between 7 and 9.9 percent.
“Non-metropolitan labor markets continue to struggle relative to metropolitan ones,” noted Quinterno. “In May, 10 percent of the non-metro labor force was unemployed, compared to 8.5 percent of the metro labor force. Compared to December 2007, the non-metro labor force now has 5 percent fewer employed persons, while the number of unemployed individuals is 80.9 percent larger.”
Over the month, unemployment rates rose in all 14 metro areas. Rocky Mount had the highest unemployment rate (12.8 percent), followed by Hickory-Morganton-Lenoir (10.1 percent) and Fayetteville (9.9 percent). Durham-Chapel Hill had the lowest unemployment rate (6.8 percent), followed by Asheville (6.9 percent) and Raleigh-Cary (7.2 percent).
Compared to May 2012, unemployment rates in May 2013 were lower in 71 counties and 11 metro areas. Over the year, labor force sizes increased in 38 counties and in 9 metros. Among metros, Charlotte’s labor force expanded at the fastest rate (+1.8 percent), followed by that of Asheville (+1.7 percent). With those changes, metro areas now are home to 71.8 percent of the state’s labor force, with 50.3 percent of the labor force residing in the Triangle, Triad, and Charlotte metros.
In the long term, improvements in overall labor market conditions depend on growth in the Charlotte, Research Triangle, and Piedmont Triad regions. Yet growth in these metros remains subdued. Collectively, employment in those three metro regions has risen by 3.6 percent since December 2007, and the combined May unemployment rate in the three regions equaled 8.2 percent. That was down from the 8.7 percent rate recorded one year ago yet was well above the 5.3 percent rate recorded in May 2008. Of the three broad regions, the Research Triangle had the lowest May unemployment rate (7.3 percent), followed by Charlotte (9 percent), and the Piedmont Triad (9.1 percent).
“Over three years into a recovery in North Carolina’s labor market, unemployment rates remain abnormally high across the state,” said Quinterno. “Minimal job growth has occurred thus far in 2013, and the odds that a brisk recovery will take hold anytime soon are slim. North Carolina simply lacks enough jobs for all those who want and need work, yet that alarming fact continues to escape the attention of state and federal policymakers.”
01.07.2013
Our Projects, Policy Points
The economic difficulties stemming from the Great Recession have demonstrated the short-run and long-run importance of public safety net and work support programs to families with children. At the same time, a variety of administrative and policy factors have constrained the effectiveness of such initiatives, thereby resulting in sizable numbers of low-income people failing to receive all of the assistance for which they are eligible. Heightened awareness of these shortcomings has sparked a variety of state-level reform efforts to strengthen and streamline public initiatives.
 To document the importance of public safety net programs and work supports, First Focus, a bipartisan children’s advocacy organization, commissioned South by North Strategies to prepare a report that documented the importance of eleven federal safety net and work support programs, identified the challenges facing those initiatives, and profiled some of the promising reform efforts underway in the states.
Entitled A Stronger Safety Net for America’s Children, the report was funded by the Foundation for Child Development, a philanthropic organization in New York City. It also was the subject of a congressional briefing held in June 2013.
13.06.2013
Policy Points
For the benefit week ending on May 25, 2013, some 10,177 North Carolinians filed initial claims for state unemployment insurance benefits and 89,579 individuals applied for state-funded continuing benefits. Compared to the prior week, there were more initial and more continuing claims. These figures come from data released by the US Department of Labor.
Averaging new and continuing claims over a four-week period — a process that helps adjust for seasonal fluctuations and better illustrates trends — shows that an average of 10,754 initial claims were filed over the previous four weeks, along with an average of 89,252 continuing claims. Compared to the previous four-week period, the average number of initial claims was higher, and the average number of continuing claims was higher.
One year ago, the four-week average for initial claims stood at 11,204 , and the four-week average of continuing claims equaled 100,624.
In recent months covered employment has increased and now exceeds the level recorded a year ago (3.82 million versus 3.76 million). Nevertheless, there are still fewer covered workers than there were in January 2008, which means that payrolls are smaller today than they were almost 5.5 years ago.
The graph shows the changes in unemployment insurance claims measured as a share of covered employment in North Carolina since the recession’s start in December 2007. 
Both new and continuing claims appear to have peaked for this cycle, and the four-week averages of new and continuing claims have fallen considerably. In fact, the four-week average of initial claims, when measured as a share of covered employment, is now at the lowest level recorded since early 2008. Yet continuing claims remain at an elevated level, which suggests that unemployed individuals are finding it difficult to find new positions.
06.06.2013
Policy Points
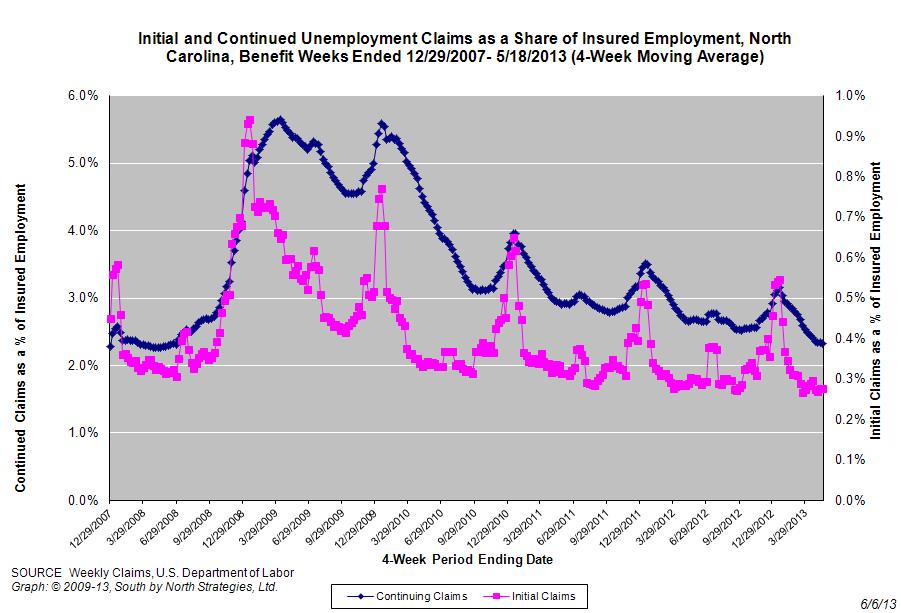
For the benefit week ending on May 18, 2013, some 9,875 North Carolinians filed initial claims for state unemployment insurance benefits and 88,643 individuals applied for state-funded continuing benefits. Compared to the prior week, there were fewer initial and fewer continuing claims. These figures come from data released by the US Department of Labor.
Averaging new and continuing claims over a four-week period — a process that helps adjust for seasonal fluctuations and better illustrates trends — shows that an average of 10,588 initial claims were filed over the previous four weeks, along with an average of 88,959 continuing claims. Compared to the previous four-week period, the average number of initial claims was higher, and the average number of continuing claims was lower.
One year ago, the four-week average for initial claims stood at 11,437 , and the four-week average of continuing claims equaled 100,354.
In recent months covered employment has increased and now exceeds the level recorded a year ago (3.82 million versus 3.76 million). Nevertheless, there are still fewer covered workers than there were in January 2008, which means that payrolls are smaller today than they were over five years ago.
The graph shows the changes in unemployment insurance claims measured as a share of covered employment in North Carolina since the recession’s start in December 2007. 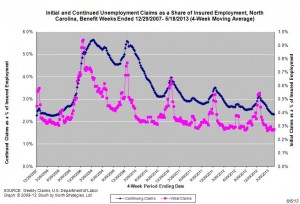
Both new and continuing claims appear to have peaked for this cycle, and the four-week averages of new and continuing claims have fallen considerably. In fact, the four-week average of initial claims, when measured as a share of covered employment, is now at the lowest level recorded since early 2008. Yet continuing claims remain at an elevated level, which suggests that unemployed individuals are finding it difficult to find new positions.


 Email Sign-Up