
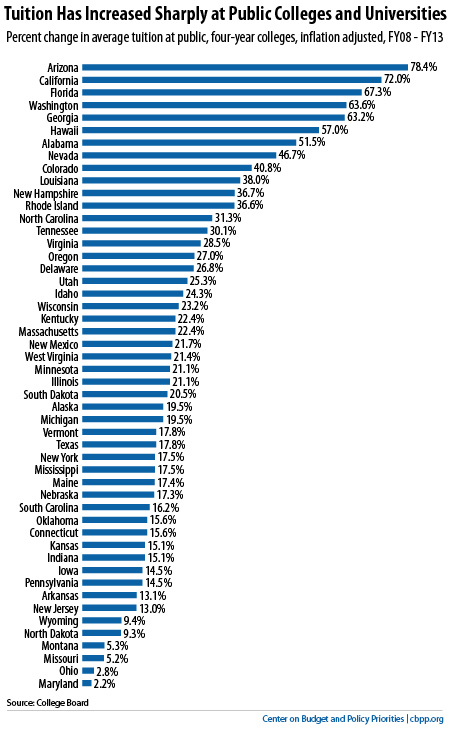
Rising College Tuitions
Off the Charts notes the degree to which states have increased tuition at public colleges and universities to compensate for reductions in general support.
Off the Charts notes the degree to which states have increased tuition at public colleges and universities to compensate for reductions in general support.
From the Economic Policy Institute’s analysis of the January 2013 version of the Job Openings and Labor Turnover Survey (JOLTS) …
The January Job Openings and Labor Turnover Survey (JOLTS), released today by the Bureau of Labor Statistics, shows job openings increased in January to nearly 3.7 million, a rise of 81,000 since December. The number of job openings, which had been improving generally since reaching its low of 2.2 million in July 2009, is still below its recent peak of 3.8 million in March 2012.
…
Hires also rose slightly in January, increasing by 52,000 to over 4.2 million. Like job openings, hires are still below their early 2012 levels. On the flip side, layoffs decreased by 62,000 in January to 1.5 million. While layoffs are not currently the primary concern in the labor market (having been at prerecession levels for more than two years), that there are fewer layoffs is definitely good news. However, because job openings and hiring remain so depressed, the consequences to workers of being laid off are far worse now than before the recession began; they are less likely to find a new job within a reasonable timeframe, particularly one that pays as much as the job lost.
CHAPEL HILL, NC (March 22, 2013) – Between January 2012 and January 2013, unemployment rates rose in 63 of North Carolina’s 100 countries and in eight of the state’s 14 metropolitan areas. Over the period, the size of the labor force grew in 79 counties and in all 14 metro areas. These findings come from new estimates prepared by the Labor and Economic Analysis Division of the North Carolina Department of Commerce.
“Compared to a year ago, local unemployment rates were higher across much of North Carolina in January,” said John Quinterno, a principal with South by North Strategies, Ltd., a research firm specializing in economic and social policy. “While the numbers from the two months are not strictly comparable due to methodological changes, the latest numbers are indicative of an economy that lacks enough employment opportunities for all those who want and need work. Last month, 76 counties and seven metro areas posted unemployment rates of at least 10 percent. In January 2008, in contrast, four counties and no metro areas logged unemployment rates of 10 percent or greater.”
Compared to December 2007, which is when the national economy fell into recession, North Carolina now has 2.9 percent fewer jobs (-120,600) and has seen its unadjusted unemployment rate climb to 10.2 percent from 4.7 percent. In January, the state added 15,100 more jobs than it lost (+0.4 percent). Since bottoming out in February 2010, the state’s labor market has netted some 5,920 jobs per month, resulting in a cumulative gain of 207,200 positions (+5.4 percent).\
Between December 2012 and January 2013, local unemployment rose in every county in the state. Individual county rates ranged from 6.6 percent in Orange County to 20.4 percent in Graham County. Overall, 76 counties posted unemployment rates greater than or equal to 10 percent, and 24 counties posted rates between 6.6 and 9.9 percent.
“Non-metropolitan labor markets continue to struggle relative to metropolitan ones,” noted Quinterno. “In January, 11.6 percent of the non-metro labor force was unemployed, compared to 9.6 percent of the metro labor force. Compared to December 2007, the non-metro labor force now has 6.6 percent fewer employed persons, while the number of unemployed individuals is 108.9 percent larger.”
Over the month, unemployment rates rose in all 14 metro areas. Rocky Mount had the highest unemployment rate (14.1 percent), followed by Hickory-Morganton-Lenoir (11.5 percent) and Fayetteville (10.8 percent). Durham-Chapel Hill had the lowest unemployment rate (7.7 percent), followed by Raleigh-Cary (8 percent) and Asheville (8.4 percent).
Compared to January 2012, unemployment rates in January 2013 were higher in 63 counties and 8 metro areas. Over the year, labor force sizes increased in 79 counties and in all 14 metros. Among metros, Asheville’s labor force expanded at the fastest rate (+3.5 percent), followed by that of Goldsboro (+3.2 percent). With those changes, metro areas now are home to 71.7 percent of the state’s labor force, with 50.4 percent of the labor force residing in the Triangle, Triad, and Charlotte metros.
In the long term, improvements in overall labor market conditions will hinge on growth in the Charlotte, Research Triangle, and Piedmont Triad regions. Yet growth in these metros remains subdued. Collectively, employment in those three metro regions has risen by 2.5 percent since December 2007, and the combined January unemployment rate in the three regions equaled 9.2 percent. That was up slightly from the 9.1 percent rate recorded one year ago and was well above the 4.9 percent rate recorded in January 2008. Of the three broad regions, the Research Triangle had the lowest January unemployment rate (8.2 percent), followed by Charlotte and the Piedmont Triad (both 10.2 percent).
“Although the numbers are not directly comparable, local labor markets across much of North Carolina began 2013 no differently than they began 2012,” said Quinterno. “Simply put, unemployment rates remain elevated across the state, and twice as many North Carolinians are jobless and seeking work than was the case five years ago.”
For the benefit week ending on March 2, 2013, some 11,832 North Carolinians filed initial claims for state unemployment insurance benefits and 104,142 individuals applied for state-funded continuing benefits. Compared to the prior week, there were more initial and fewer continuing claims. These figures come from data released by the US Department of Labor.
Averaging new and continuing claims over a four-week period — a process that helps adjust for seasonal fluctuations and better illustrates trends — shows that an average of 11,804 initial claims were filed over the previous four weeks, along with an average of 106,5906 continuing claims. Compared to the previous four-week period, the average number of initial claims was lower, as was the average number of continuing claims.
One year ago, the four-week average for initial claims stood at 11,763, and the four-week average of continuing claims equaled 118,058.
In recent months covered employment has increased and now exceeds the level recorded a year ago (3.8 million versus 3.7 million). Nevertheless, there are still fewer covered workers than there were in January 2008, which means that payrolls are smaller today than they were approximately five years ago.
The graph shows the changes in unemployment insurance claims measured as a share of covered employment in North Carolina since the recession’s start in December 2007. 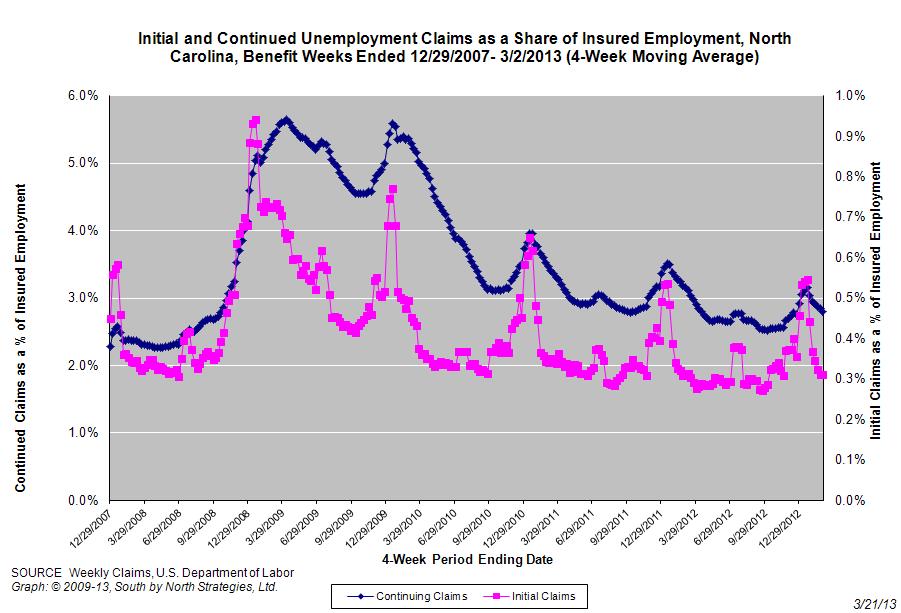
Both new and continuing claims appear to have peaked for this cycle, and the four-week averages of new and continuing claims have fallen considerably. Yet continuing claims remain at an elevated level, which suggests that unemployed individuals are finding it difficult to find new positions.
For the benefit week ending on February 23, 2013, some 11,696 North Carolinians filed initial claims for state unemployment insurance benefits and 106,452 individuals applied for state-funded continuing benefits. Compared to the prior week, there were fewer initial and fewer continuing claims. These figures come from data released by the US Department of Labor.
Averaging new and continuing claims over a four-week period — a process that helps adjust for seasonal fluctuations and better illustrates trends — shows that an average of 11,854 initial claims were filed over the previous four weeks, along with an average of 108,016 continuing claims. Compared to the previous four-week period, the average number of initial claims was lower, as was the average number of continuing claims.
One year ago, the four-week average for initial claims stood at 11,549, and the four-week average of continuing claims equaled 119,452.
In recent months covered employment has increased and now exceeds the level recorded a year ago (3.8 million versus 3.7 million). Nevertheless, there are still fewer covered workers than there were in January 2008, which means that payrolls are smaller today than they were approximately five years ago.
The graph shows the changes in unemployment insurance claims measured as a share of covered employment in North Carolina since the recession’s start in December 2007. 
Both new and continuing claims appear to have peaked for this cycle, and the four-week averages of new and continuing claims have fallen considerably. Yet continuing claims remain at an elevated level, which suggests that unemployed individuals are finding it difficult to find new positions.
 Email Sign-Up |