Biannual Jobs Review
07.08.2013
Biannual Jobs Review, News Releases, Policy Points
(August 8, 2013) – North Carolina’s labor market recorded little net employment growth (seasonally adjusted) over the first six months of 2013. During the first half of the year, the state gained 16,100 more payroll jobs than it lost (+0.4 percent). The private sector accounted for all of the net job growth. Moreover, all of the net job growth experienced so far in 2013 occurred during the year’s first three months; in fact, the state experienced no net job growth during the second quarter of 2013.
Given such weak job growth, relatively little progress was made against unemployment. While the number of unemployed individuals and the unemployment rate fell during the first half of 2013, those drops were intertwined with a 1.2 percent decline in the size of the state’s labor force. Compared to a year ago, 4,441 fewer North Carolinians were part of the labor force (-0.1 percent). And compared to five years earlier, only 6,049 more North Carolinians were employed in June (+0.1 percent), while 140,765 more persons were unemployed (+51 percent).
Six Months of Slow Job Growth
During the first six months of 2013, business establishments in North Carolina added 16,100 more payroll jobs than they shed (+0.4 percent). The private sector drove that growth by netting 16,900 positions (+0.5 percent), but the public sector shed 800 more positions than it gained (-0.1 percent). With those changes, North Carolina’s public sector (federal, state, and local) employs 5,800 fewer persons (-0.8 percent) than it did in June 2008. All of the public-sector losses occurred in the state government and local government subsectors, both of which now have fewer positions than they did five years ago.
Fig. 1 shows, the monthly pattern of job growth in 2013. When the monthly totals are grouped into calendar quarters, distinct patterns emerge. In Q1 (Jan.-Mar.), private payrolls gained 15,100 more positions than they lost (+0.5 percent), and public payrolls netted 1,100 jobs (+0.2 percent), resulting in a net gain of 16,200 jobs (+0.4 percent). In Q2 (Apr.-Jun.), private-sector growth slowed (+1,800 jobs, +0.1 percent), and public-sector employers shed 1,900 positions (-0.3 percent), leading to a net loss of 100 jobs (+/- 0 percent). The cumulative result was a six-month net gain of 16,100 jobs.

The first half of 2013 was the most disappointing one for net job growth in North Carolina since the onset of the recovery. The net gain of 16,100 jobs was 64.4 percent smaller than the gain recorded during the first half of 2012, 23.7 percent lower than the gain recorded during the first half of 2011, and 34.8 percent smaller than the gain recorded during the first half of 2010. The 0.4 percent rate of net job growth logged during the first half of 2013 also was lower than the growth rates posted during the first halves of 2012, 2011, and 2010 (+1.2 percent, +0.5 percent, and +0.6 percent, respectively).
Job growth during the first part of 2013 did not occur uniformly across industries (fig. 2). The leisure and hospitality sector grew the most in absolute terms (+12,200 jobs, +2.9 percent); some 75.4 percent of that growth was attributable to the accommodation and food services subsector (+9,200 jobs, +2.5 percent). The next largest net increase was in the professional and business services sector (+7,900 jobs, +1.5 percent), with 77.2 percent of that growth originating in the administrative and waste management subsector. The information sector contributed 3,000 jobs (+4.3 percent) to the six-month net change, followed by the finance sector (+2,500 jobs, +1.2 percent.)
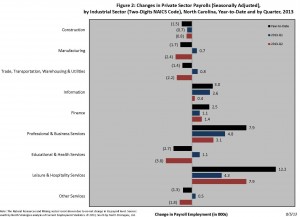
In terms of contracting private-sector industries, education and health services lost the most jobs in absolute terms (-2,700 jobs, -0.5 percent), followed by manufacturing (-1,700, -0.4 percent, with 70.6 percent of the decline linked to manufacturers of non-durable goods), construction (-1,500 jobs, -0.9 percent), trade, transportation, warehousing, and utilities (-1,400 jobs, -0.2 percent), and other services (-1,300, -0.9 percent).
Note that the industrial employment patterns seen since the February 2010 onset of a labor market recovery are inconsistent with the claim that joblessness is the result of mismatches between workforce skills and job requirements. Some 23.6 percent of the net private-sector job growth recorded between February 2010 and June 2013 occurred in the administrative and waste management (including temporary help services) subsector, while another 35.4 percent originated in the accommodation and food services (20 percent) and the retail trade (11.8 percent) industrial subsectors. All three of those fields generally employ significant numbers of workers with modest skill levels. They also are industries that tend to pay relatively low wages, offer few benefits, and provide little stability or predictability. Workers consequently tend to turn toward these industries when they have few other employment options.
A Sizable Job Gap Remains
The weak job growth recorded during the first half of 2013 did little to replace the jobs lost earlier in the business cycle. From the onset of the “Great Recession” in December 2007 through June 2013, North Carolina lost, on net, 119,600 positions, or 2.9 percent of its payroll employment base. The maximum job loss recorded during the period occurred in February 2010, when the state had 327,800 fewer jobs (-7.9 percent) than it did 26 months earlier. Between then and June 2013, North Carolina netted an average of 5,200 payroll jobs per month, resulting in a cumulative gain of 208,200 positions (+5.4 percent).
While the state’s economy added more jobs than it lost during the first half of 2013, the rate of job growth was too subdued to alter materially the employment situation. Even if the North Carolina labor market succeeded in adding another 16,100 jobs during the second half of 2013 and then managed to replicate that gain every six months going forward, it would take through the end of 2016 to close the jobs gap that existed in June, holding all else equal.
As fig. 3 shows, the job losses recorded during the Great Recession have proven more severe than the ones experienced during the 2001 and 1990-1991 recessions. At the height of the 2001 recession, the state lost 4.5 percent of its jobs base, and the comparable drop during the 1990-1991 recession was 1.9 percent. In both of those recessions, the job gap closed steadily after the peak losses were realized. During the current cycle, however, the peak contraction was greater, and the recovery has proven much slower.

To further understand the magnitude of the job gap facing North Carolina, consider how the state had only 111,800 more payroll jobs (+2.8 percent) in June 2013 than it had in June 2000, despite having a much larger economy. Between 2000 and 2012, the last year with complete data, economic output in North Carolina rose by 24.1 percent in inflation-adjusted terms. Moreover, the state has regained all of the economic output lost earlier in the Great Recession, and the statewide economy was, in real terms, 3.7 percent larger in 2012 than it was in 2007. Such growth, however, has not sparked job growth.
Remember, too, that the job shortfall facing North Carolina actually is larger than the one caused by the destruction of jobs during the recession. Between December 2007 and June 2013, the number of working-age persons residing in North Carolina grew by 8.9 percent. That means that the state should have added an estimated 390,000 jobs to keep pace with population growth. If one considers the jobs that should have been created since December 2007 but were not, the job gap facing the state in June 2013 was 509,000 positions (fig. 4).

To close that gap by June 2016, holding all else equal, North Carolina would need to net 14,100 jobs per month for each of the next 36 months — an average monthly net gain 2.7 times greater than the one experienced between February 2010 and June 2013. At no point since 1990 has North Carolina sustained such growth for so long. In fact, North Carolina has netted at least 14,000 payroll jobs in just 39 of the 282 months (13.8 percent) stretching from January 1990 to June 2013.
Unemployment Still Alarmingly Elevated
Weak job growth during the first half of 2012 did little to reduce the problems of unemployment and joblessness across North Carolina. The monthly number of unemployed Tar Heels (seasonally adjusted) averaged 431,126. Unemployment was higher in both absolute and relative terms during the first quarter of the year than in the second quarter. From January 2013 to June 2013, the statewide unemployment rate fell from 9.5 percent to 8.8 percent, which was the lowest level recorded since December 2008. That said, unemployment remained elevated by any objective measure. In June 2013, for instance, the statewide unemployment rate was almost double the rate posted in June 2007 (8.8 percent versus 4.7 percent), and the total number of unemployed persons was 96.7 percent larger.
When judged in terms of the statewide unemployment rate (seasonally unadjusted), the recent recession has proven to be the longest and most severe of any post-1980 downturn (fig. 5). Between 1980 and 2008, the highest unemployment rate recorded in North Carolina was 11.3 percent in March 1983. During the same 28-year period, the unemployment rate exceeded 10 percent in four months, all in the early 1980s. Since February 2009, however, the seasonally unadjusted unemployment rate has exceeded 10 percent in 34 of 53 months (64.2 percent) and has fallen no lower than 8.8 percent.
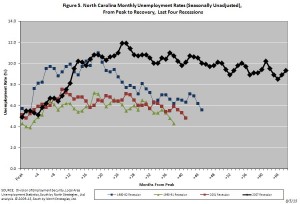
In every other post-1980 recession, the state unemployment rate had returned to its pre-recessionary level by 45 months following the onset of the downturn. Despite the passage of 66 months since the onset of the most recent recession, North Carolina’s seasonally unadjusted unemployment rate of 9.3 percent in June was 4.4 percentage points higher than the December 2007 level of 4.9 percent.
Unemployment Is One of Many Labor Market Problems
The size of the state’s civilian labor force (seasonally adjusted) contracted by 57,970 individuals (-1.2 percent) during the first half of 2013. In June 2013, the state’s labor force had 4,441 fewer individuals (-0.9 percent) than the year before, even though the number of working-age people in the state had grown by 78,000 individuals, or 1 percent (fig 6).
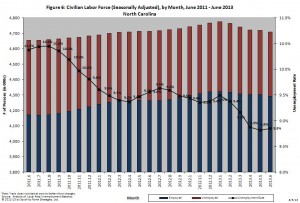
An important reason why the size of the labor force has held relatively constant despite steady growth in the population of working-age people is the sharp drop in the labor force participation rate, which measures the share of the working-age population that is employed or unemployed.
In June 2013, the state’s seasonally adjusted labor force participation rate equaled 62.2 percent, a rate that is both lower than then the 62.9 percent figure posted a year earlier and close to the 37-year low of 62.2 percent set earlier in the downturn. The depressed labor force participation rate indicates that many people of working age are not participating in the labor market, either by choice (e.g., retirees and homemakers) or due to discouragement. This suggests that joblessness is more widespread than reflected in the official unemployment rate.
To put the depressed labor force participation rate in context, consider how the rate equaled 67.5 percent in June 2000. If the rate had held constant, all else being equal, the number of employed and unemployed persons residing in North Carolina in June 2013 would have totaled 5,107,795 — a number 8.5 percent greater than the actual figure of 4,709,264. While the labor force participation rate likely should have dropped to some degree over the past 13 years due to demographic changes, the magnitude of the drop suggests that cyclical factors are at play.
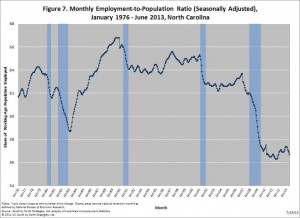
Two additional measures help to illustrate the extent to which labor currently is sitting idle in North Carolina. The first measure is the employment-to-population ratio, which reflects the share of the working-age population that is employed. In June 2013, the employment-to-population ratio in North Carolina was 56.7 percent, down from the 57.4 percent rate recorded in December 2012 and and the 56.9 percent figure posted a year earlier.
While the employment-to-population ratio has increased somewhat from the extraordinary low level of 56.3 percent experienced in the third quarter of 2011, the ratio remains near that 37-year low (fig. 7). If the rate in June 2013 had equaled the June 2000 figure of 65 percent, holding all else equal, the number of employed persons residing in North Carolina would have totaled 4,918,600 — a figure 4.4 percent greater than the actual one of 4,709,264.
The second important measure is the underemployment rate, which is a broader gauge of labor under-utilization prepared quarterly by the US Bureau of Labor Statistics. This statistic captures the share of the state’s adjusted labor force that was unemployed, working part-time despite wanting full-time work, or marginally attached to the workforce (due to discouragement or other reasons). During the second quarter of 2013, North Carolina’s underemployment rate equaled 15.6 percent, down slightly from the 16.2 percent rate posted in the first quarter of the year.
Regardless of the exact measure used, a sizable amount of labor in North Carolina was sitting idle in June. Almost nine of every 100 members of the state’s labor force were unemployed (seasonally adjusted), while almost 16 of every 100 persons in the adjusted labor force were underemployed. Compared to 13 years ago, more North Carolinians were unemployed in both absolute and relative terms in June, and smaller shares of the working-age population were employed or were even participating in the labor force.
The fundamental reason why so many potential workers are sitting on the labor market’s sidelines is a lack of jobs. According to the Job Openings and Labor Turnover Survey conducted by the US Bureau of Labor Statistics, the ratio of unemployed adults to available job openings in June 2013 in the South was 2.6-to-1 (state-level data are unavailable). In short, there simply were no jobs for almost two of every three unemployed Southerners in June.
Geographic Patterns of Unemployment
During the first half of 2013, labor market conditions remained weak across North Carolina. In June 2013, 44 counties had unemployment rates of at least 10 percent. Compared to a year earlier, unemployment rates were lower in 85 counties, higher in 12 counties, and unchanged in three counties. (All local figures are seasonally unadjusted.)
Labor markets in non-metropolitan communities remained particularly weak during the first part of 2013. In June 2012, the unemployment rate in non-metropolitan North Carolina was 10.3 percent, down from the 10.7 percent rate recorded one year earlier. The metropolitan unemployment rate also fell over the course of the year, dropping to 8.9 percent from 9.4 percent. Meanwhile, 8.6 percent of the combined labor force residing in the “Big Three” metro areas of Charlotte, the Research Triangle, and the Piedmont Triad was unemployed.
From the onset of the recession until June 2013, the size of North Carolina’s non-metro labor force rose by 1,364 individuals (+0.1 percent), while the metropolitan labor force gained 236,697 members (+7.5 percent). Within metro North Carolina, growth in the “Big Three” metros accounted for 71.5 percent of the total gain.
As fig. 8 shows, the labor market performances of North Carolina’s metro areas varied over the year. Nine of the state’s 14 areas recorded decreases in their labor forces, with the greatest declines occurring in the Rocky Mount (-2.1 percent) and Hickory-Morganton-Lenoir (-1.6 percent) metros. In contrast, Asheville’s labor force grew by 1.4 percent, followed by the Greenville metro (+1.1 percent). Since the start of the recession, the greatest rates of labor force growth have occurred in Jacksonville (+12.6 percent) and Greenville (+12.3 percent), followed by Fayetteville (+11 percent) and Raleigh-Cary (+10.4 percent).
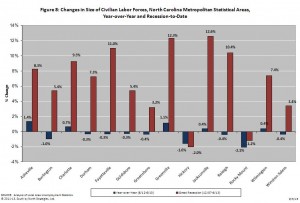
At 7.1 percent, Asheville had the lowest metro unemployment rate in June 2013. Next came Durham-Chapel Hill (7.3 percent), Raleigh-Cary (7.5 percent), Winston-Salem (8.7 percent), Goldsboro (9.2 percent), and Charlotte (9.3 percent). The highest rates were in Rocky Mount (13.3 percent), Hickory (10.5 percent), and Fayetteville (10.4 percent).
When looking at local unemployment numbers, it is important to place them in perspective. The 7.1 percent unemployment rate found in the Asheville metro in June, for instance, was low relative to the performance of other North Carolina metros, yet it is was high by any objective standard. Consider how in June 2008 just 4.9 percent of Asheville’s labor force was unemployed. Five years later, the area’s unemployment rate was 2.2 percentage points higher, while the number of unemployed residents was 51.4 percent larger. Despite faring better than other metros in the state, Asheville’s labor market hardly can be called robust.
Cloudy Prospects
The first half of 2013 proved highly disappointing for North Carolina’s labor market. While the year began on a positive note thanks to hiring in the private sector during the year’s first quarter, growth ground to a halt in the second quarter. The resulting net gain of 16,100 payroll jobs was the worst first-half gain in both absolute and relative terms recorded since the onset of the recovery. If the trends continue during the second half of the year, 2013 will be the worst year for job growth in North Carolina since the advent of the recovery.
While the statewide unemployment rate did fall during the first half of the year and now is the lowest rate posted since late 2008, the decline was intertwined with a movement of people out of the labor force. Compared to December 2012, some 30,300 fewer North Carolinians were unemployed (-6.8 percent), but the number of employed persons also fell over the same period. Compared to the start of the year, 27,700 fewer North Carolinians now have jobs (-0.6 percent). The decline in the unemployment rate therefore is attributable to a contraction in the size of the labor force rather than improved employment prospects for North Carolinians.
In sum, the current rate of job growth in North Carolina is insufficient to close the state’s sizable job gap anytime soon. The problem of mass joblessness consequently should endure, even if the extent of the problem is being masked to some degree by a decline in the unemployment rate. Some 5.5 years after the onset of the Great Recession, a full recovery for North Carolina’s labor market remains a distant goal.
#####
Individuals with a printed copy of this analysis may access it online at http://www.sbnstrategies.com/?p=13278 or by scanning the QR code below.

All materials within this analysis Copyright © 2013 by South by North Strategies, Ltd.
22.08.2012
Biannual Jobs Review, Policy Points
Click here to view this report in Adobe Acrobat format.
(August 22, 2012) North Carolina’s labor market experienced little payroll employment growth during the first six months of 2012. Between December 2011 and June 2012, the state gained 22,700 more payroll jobs than it lost (+0.6 percent). Nearly 90 percent of that net gain originated in the private sector. Moreover, all of the year’s net job growth occurred during the first three months of 2012; in fact, the state actually lost more jobs than it gained during the year’s second quarter.
Given such weak growth, relatively little progress was made against unemployment. While the number of unemployed individuals and the statewide unemployment rate fell during the first half of 2012, those drops largely were intertwined with a 0.5 percent decline in the size of the state’s labor force. Compared to five years earlier, some 57,332 fewer North Carolinians were employed in June (-1.3 percent), while 227,531 more persons were unemployed (+107.4 percent).
Job Growth In 2012 Started Strong, Then Stalled
During the first six months of 2012, business establishments in North Carolina added 22,700 more payroll jobs than they shed (+0.6 percent). The private sector drove that growth by netting 20,400 positions (+0.6 percent), which amounted to 89.9 percent of the total gain. The public sector, meanwhile, gained 2,300 positions (+0.3 percent). That increase resulted from net hiring by local governments (+6,700 jobs, +1.5 percent), which was almost entirely offset by net reductions in state government payrolls (-4,000 jobs, -2.1 percent). With those changes, the number of local government payroll jobs in North Carolina was slightly beneath the level recorded in June 2008. Similarly, the total number of state government jobs in North Carolina in June 2012 was 3.6 percent lower than the level posted in the same month four years earlier.
Fig. 1 shows, the monthly pattern of job growth in 2012. When the monthly totals are grouped into calendar quarters, distinct patterns emerge. In Q1 (Jan.-Mar.), private payrolls gained 23,000 more positions than they lost (+0.7 percent), and public payrolls netted 4,200 jobs (+0.6 percent), leading to a net gain of 27,200 jobs (+0.7 percent). In Q2 (Apr.-Jun.), private-sector growth turned negative (-2,600 jobs, -0.1 percent), and public-sector employers shed 1,900 positions (-0.3 percent), resulting in a net loss of 4,500 jobs (-0.1 percent). The cumulative result was an overall six-month net gain of 22,700 jobs, all of which occurred in Q1.

The private-sector gains logged during the first half of 2012 did not occur uniformly across industries (fig. 2). The trade, transportation, warehousing, and utilities sector grew the most in absolute terms (+11,400 jobs, +0.3 percent); some 46 percent of the growth in the sector was attributable to the retail trade sub-sector (+5,200 jobs, +0.1 percent). The next largest net increase was found in the professional and business services sector (+8,700 jobs, +0.2 percent), with 79.3 percent of that growth originating in the professional, scientific, and technical services sub-sector. The finance sector contributed 5,700 jobs to the six-month net change, followed by the manufacturing and education and health services sectors (both +3,500 jobs.)

In terms of contracting private-sector industries, construction lost the most jobs in absolute and relative terms (-6,600 jobs, -0.2 percent), followed by other services (-4,700, -0.1 percent) and leisure and hospitality services (-2,200 jobs, -0.1 percent). Despite those losses, the leisure and hospitality services sector accounted for 10.1 percent of all private-sector jobs in North Carolina in June and was the source of 13 percent of all the private-sector jobs growth that took place from February 2010, the month when the state’s job market bottomed out, to June 2012.
Note that the industrial employment trends since the February 2010 onset of a labor market recovery are inconsistent with the claim that unemployment is the result of mismatches between workforce skills and job requirements. Some 53.4 percent of the net private-sector job growth recorded between February 2010 and June 2012 occurred in the accommodation and food services, retail trade, and administrative and waste management (including temporary help services) industrial sub-sectors; these are fields that generally employ significant numbers of workers with modest skill levels.
Large Job Gap Remains, Unlikely To Close Anytime Soon
The weak job growth recorded during the first half of 2012 did little to replace the jobs lost earlier in the business cycle. From the onset of the “Great Recession” in December 2007 through June 2012, North Carolina lost, on net, 221,800 positions, or 5.3 percent of its payroll employment base. The maximum job loss recorded during the business cycle occurred in February 2010, when the state had 326,300 fewer jobs (-7.8 percent) than it did 26 months before. Between then and June 2012, North Carolina netted 104,500 positions (+2.7 percent), for an average monthly gain of 3,732 jobs.
While the state’s economy netted more than two-thirds as many jobs in the first half of 2012 as it did in all of 2011 (+22,700 versus +33,300), the rate of job growth slowed over the course of the year and remains too weak to materially alter the employment situation. Even if the North Carolina labor market succeeded in adding another 22,700 jobs during the second half of 2012 and managed to replicate that gain every six months going forward, it would take until the first half of 2017 to close the jobs gap that existed in June, holding all else equal.
As fig. 3 shows, the job losses recorded during the Great Recession have proven more severe than the ones experienced during the 2001 and 1990-1991 recessions. At the height of the 2001 recession, the state lost 4.5 percent of its jobs base, while the comparable drop during the 1990-1991 recession was 1.9 percent. In both of those recessions, the job gap began to steadily close after the peak losses were realized. During the current cycle, however, the peak contraction was greater, and the recovery has been much slower.

To further understand the magnitude of the job gap facing North Carolina, consider how the state had only 18,300 more payroll jobs (+0.5 percent) in June 2012 than it had in June 2000, despite having a much larger economy. Between 2000 and 2011, the last year with complete data, economic output in North Carolina rose by 21.6 percent in inflation-adjusted terms. Moreover, the state has regained all of the economic output lost earlier in the Great Recession, and the statewide economy was, in real terms, 1.7 percent larger in 2011 than it was in 2007. Such growth, however, has neither sparked job growth nor boosted average living standards.
Remember, too, that the job shortfall facing North Carolina is actually larger than the one caused by the destruction of jobs during the recession. Between December 2007 and June 2012, the number of working-age persons increased by 534,724 persons (+7.7 percent). This means that payroll employment in the state should have been growing at an average monthly rate of 0.1 percent to keep pace. If one considers the jobs that should have been created since December 2007 but were not, the job gap facing the state in June 2012 equaled 555,700 positions (fig. 4).

To close that gap by December 2015, holding all else equal, North Carolina would need to net 13,231 jobs per month for each of the next 42 months — an average monthly net gain 3.5 times greater than the one experienced between February 2010 and June 2012. At no point since 1990 has North Carolina sustained such growth for so long. In fact, North Carolina has netted at least 13,200 payroll jobs in just 42 of the 258 months (16.3 percent) stretching from January 1990 to June 2012.
Joblessness Remains Widespread
Weak job growth during the first half of 2012 did little to reduce the problems of unemployment and joblessness in North Carolina. The monthly number of unemployed Tar Heels (seasonally adjusted) averaged 451,134. Unemployment was higher in both absolute and relative terms during the first quarter of the year than in the second quarter. From December 2011 to June 2012, the statewide unemployment rate fell from 10.4 percent to 9.4 percent, which was the lowest level recorded since early 2009. That said, unemployment remained elevated by any objective measure. In June 2007, for instance, the statewide unemployment rate was half as high as the rate posted in June 2012 (4.7 percent versus 9.4 percent), and the total number of unemployed persons was 51.8 percent smaller.
When judged in terms of the statewide unemployment rate (seasonally unadjusted), the recent recession has proven to be the longest and most severe of any post-1980 downturn (fig. 5). Between 1980 and 2008, the highest unemployment rate recorded in North Carolina was 11.3 percent in March 1983. During the same 28-year period, the unemployment rate exceeded 10 percent in four months, all in the early 1980s. Since February 2009, however, the seasonally unadjusted unemployment rate has exceeded 10 percent in 35 of 41 months and has fallen no lower than 9.4 percent.

In every other post-1980 recession, the state unemployment rate had returned to its pre-recessionary level by 45 months following the onset of the downturn. Despite the passage of 54 months since the onset of the last recession (as of June 2012), North Carolina’s seasonally unadjusted unemployment rate of 9.4 percent was 4.5 percentage points higher than the December 2007 level of 4.9 percent.
Unemployment One Labor Market Problem Among Many
The size of the state’s civilian labor force (seasonally adjusted) contracted by 21,849 individuals (-0.5 percent) between December 2011 and June 2012. Compared to a year earlier, the state’s labor force had just 5,878 more individuals (+0.1 percent), even though the number of working-age people in the state had grown by 78,908 individuals, or 1.1 percent (fig 6).

An important reason why the size of the labor force has held relatively constant despite steady growth in the population of working-age people is the sharp drop in the labor force participation rate, which measures the share of the working-age population that is employed or unemployed.
In June 2012, the state’s seasonally adjusted labor force participation rate equaled 62.1 percent. While this level was up slightly compared to the June 2011 level of 61.9 percent, it remains close to the 36-year low of 61.6 percent set earlier in the downturn. The depressed labor force participation rate indicates that many people of working age are not participating in the labor market, either by choice (e.g., retirees, homemakers, and students) or due to discouragement. This suggests that joblessness is more widespread than reflected in the official unemployment rate.
To put the depressed labor force participation rate in context, consider how the rate equaled 67.5 percent in June 2000. If the rate had held constant, the number of employed and unemployed persons residing in North Carolina in June 2012 would have totaled 5,049,238 — a number 8.2 percent greater than the actual figure of 4,665,387. While the labor force participation rate likely should have dropped to some degree over the past 12 years owing to demographic effects, the magnitude of the drop suggests that cyclical factors are at play.
Two additional measures help to illustrate the extent to which labor currently is sitting idle in North Carolina. The first measure is the employment-to-population ratio, which reflects the share of the working-age population that is employed. In June 2012, the employment-to-population ratio in North Carolina was 56.1 percent, down from the 56.3 percent rate recorded in December 2011 but up from the 55.8 percent figure posted one year earlier.
While the employment-to-population ratio has increased somewhat from the extraordinary low level of 55.3 percent experienced in the third quarter of 2011, the ratio remains near that 36-year low (fig. 7). If the rate in June 2012 had equaled the June 2000 one of 65 percent, holding all else constant, the number of employed persons residing in North Carolina would have totaled 4,862,229 — a figure 15.3 percent greater than the actual figure of 4,216,014.

The second important measure is the underemployment rate, which is a broader gauge of labor under-utilization prepared quarterly by the US Bureau of Labor Statistics. This statistic captures the share of the state’s adjusted labor force that was unemployed, working part-time despite wanting full-time work, or marginally attached to the workforce (due to discouragement or other reasons). During the second quarter of 2012, North Carolina’s underemployment rate equaled 17.5 percent, down slightly from the 17.6 percent rate posted in the first quarter of the year.
Regardless of the exact measure used, a sizable amount of labor in North Carolina was sitting idle in June. Slightly more than nine of every 100 members of the state’s labor force were unemployed (seasonally adjusted), while more than 17 of every 100 persons in the adjusted labor force were underemployed. Compared to 12 years ago, more North Carolinians were unemployed in both absolute and relative terms in June, and smaller shares of the working-age population were employed or were even participating in the labor force.
The fundamental reason why so many potential workers are sitting on the labor market’s sidelines is a lack of jobs. According to the Job Openings and Labor Turnover Survey conducted by the US Bureau of Labor Statistics, the ratio of unemployed adults to available job openings in June 2012 in the South was 3-to-1 (state-level data are unavailable). In short, there simply were no jobs for two of every three unemployed Southerners in June.
Geographic Patterns In Joblessness
During the first half of 2012, labor market conditions remained weak across North Carolina. In June 2012, 61 counties had unemployment rates of at least 10 percent. Compared to a year earlier, unemployment rates were lower in 91 counties, higher in six counties, and unchanged in three counties. (All local figures are seasonally unadjusted.)
Labor markets in non-metropolitan communities remained particularly weak during the first part of 2012. In June 2012, the unemployment rate in non-metropolitan North Carolina was 10.9 percent, down from the 11.9 percent rate recorded one year earlier. The metropolitan unemployment rate also fell over the course of the year, dipping to 9.4 percent from 10.5 percent. Meanwhile, 9.2 percent of the combined labor force residing in the “Big Three” metro areas of Charlotte, the Research Triangle, and the Piedmont Triad was unemployed.
From the onset of the recession until June 2012, the size of North Carolina’s non-metro labor force declined by 5,697 individuals (-0.4 percent), while the metropolitan labor force gained 201,217 members (+6.4 percent). Within metro North Carolina, growth in the “Big Three” metros accounted for 70.9 percent of the total gain.
As fig. 8 shows, the labor market performances of North Carolina’s metro areas varied over the year. Eleven of the state’s 14 areas recorded increases in their labor forces, with the greatest gains occurring in the Raleigh-Cary (+3.1 percent) and Jacksonville (+2.3 percent) metros. In contrast, Wilmington’s labor force shrank by 2.2 percent, followed by the Hickory-Morganton-Lenoir and Greenville metros (both -0.1 percent). Since the start of the recession, the greatest rates of labor force growth have occurred in the military communities of Jacksonville (+13.7 percent) and Fayetteville (+12.5 percent), followed by Raleigh (+10 percent) and Asheville (+6.6 percent).

At 7.9 percent, Asheville and Durham-Chapel Hill tied for the lowest metro unemployment rate in June 2012. Next came Raleigh (8 percent), Goldsboro (9 percent), Jacksonville (9.2 percent), and Winston-Salem (9.3 percent). The highest rates were in Rocky Mount (13.2 percent), Hickory (11.2 percent), and Greenville (10.6 percent).
When looking at local unemployment numbers, it is important to place them in perspective. The 7.9 percent unemployment rate found in the Asheville metro in June, for instance, was low relative to the performance of other North Carolina metros, yet it is was high by any objective standard. Consider how in June 2008 just 4.8 percent of Asheville’s labor force was unemployed. Four years later, the area’s unemployment rate was 3.1 percentage points higher, while the number of unemployed residents was 69.2 percent larger. Despite faring better than other metros in the state, Asheville’s labor market hardly can be called robust.
Economic Hardships Continue To Mount
As mentioned previously, a lack of jobs continues to be the most serious problem facing working North Carolinians. Given the depressed demand for labor and the relative scarcity of job openings, it is not surprising that individuals who have lost jobs are experiencing prolonged bouts of unemployment.
In June 2012, 41.9 percent of all unemployed Americans had been jobless for at least six months, with the average spell of unemployment lasting 39.9 weeks. Unfortunately, the longer workers are unemployed, the less likely they are to secure new positions due to competition, skills deterioration, and employer stereotyping. If the trends continue, many of North Carolina’s long-term unemployed probably will never regain work.
Due to the length of the recession, many of the long-term unemployed increasingly have been left to their own devices. Nationwide, only about 46 percent of unemployed Americans receive unemployment insurance payments, according to estimates from the National Employment Law Project, and many of those who are fortunate enough to receive insurance payments are facing payment reductions.
Congressional decisions related to the provision of emergency and extended insurance payments beyond the 26-week maximum payment period common in North Carolina and most states mean that most forms of emergency and extended benefits will lapse by year’s end. The maximum number of weeks of state and federal insurance payments available to North Carolinians already has fallen to 79 weeks from 99 weeks due to changes in the Extended Benefits (EB) Program — changes that reduced insurance for some 22,500 North Carolinians. Moreover, the entire Emergency Unemployment Compensation (EUC) Program will expire at the end of 2012. Other changes to the EUC program ensure that eligible workers will receive fewer weeks of compensation than earlier in the recession and that no one who loses a job after July 2012 will receive any supplemental insurance.
Perhaps the most troubling indicator of the economic hardships facing North Carolina’s households is the surge in the size of the state’s Supplemental Nutrition Assistance Program (SNAP) caseload. Between December 2007 and May 2012, the most recent month with data, the number of Tar Heels participating in the program grew by 79.1 percent, or 730,285 persons (fig. 9). Much of the growth is attributable to job losses among individuals with modest incomes — job losses that pushed their household incomes below the program eligibility level (gross monthly income of 130 percent of the poverty level, or $2,422 for a four-person household). As a result, 17.1 percent of the state’s residents were connected to the food assistance program in May.

A Cloudy Horizon
Thus far, 2012 has proven to be a disappointing year for North Carolina’s labor market, which, through June, had gained only 22,700 more jobs than it lost. While the private sector performed relatively well during the year’s first quarter, at least by recent standards, it contracted during the second quarter. That said, the current overall rate of growth in the state’s job market simply is insufficient to close the large job gap anytime soon. Some 4.5 years after the onset of the Great Recession, a full recovery remains years away.
Absent a surge in the second half of the year, North Carolina’s labor market will continue to sputter. While payrolls likely will inch upward with some level of net growth occurring in most private industrial sectors, jobs should remain scarce. That means the problems of abnormally high levels of unemployment and underemployment will remain, so economic hardships should remain pronounced across the state.
For the long-term unemployed, their odds of returning to work will continue to drop, yet the tattered state of the nation’s safety net means that little help will be available for such individuals. Moreover, the relative indifference of policymakers to the ill health of the labor market combined with an inexplicable insistence on pursuing contractionary policies will exacerbate the problems facing North Carolinians who want and need work.
North Carolina’s labor market currently is on pace to perform better than it did in 2011, yet such relative progress simply is not good enough in light of the problems facing the state. Consequently, 2012 is on track to become the fifth consecutive year of minimal or negative job growth in North Carolina.
###
Individuals with a printed copy of this analysis may access it online at http://www.sbnstrategies.com/?p=11589 or by scanning the QR code below.

All material within this analysis Copyright © 2012 by South by North Strategies, Ltd. All rights reserved.
10.02.2012
Biannual Jobs Review, Policy Points
(February 10, 2012) North Carolina’s labor market experienced minimal payroll employment growth during 2011. Between December 2010 and December 2011, the state gained 19,600 more payroll jobs than it lost (+0.5 percent). Though the private sector netted 29,400 positions, a net drop of 9,800 government jobs erased one-third of the private-sector gain. With such weak growth, little progress was made against unemployment. Both the number of unemployed individuals and the share of the labor force that was unemployed rose in 2011. And, 2011 marked the fourth consecutive year of negative (2008 and 2009) or minimal (2010 and 2011) job growth in North Carolina.
Private-Sector Job Growth, Public-Sector Contraction
During 2011, business establishments in North Carolina added 19,600 more payroll jobs than they cut. The private sector drove that growth by netting 29,400 positions, while the public sector lost 9,800 more positions than it added. Net declines in state government (-6,500 jobs, -3.4 percent) and local government (-4,500, -1 percent) employment drove the public-sector contraction. Compared to December 2007, state government payrolls were 5.5 percent smaller (-10,900 jobs) in December 2011, while local governments collectively had 6,100 fewer positions (-1.4 percent). If public sector payrolls had held steady in 2011, all else equal, North Carolina would have ended the year with 0.3 percent more jobs than it did.
 Fig. 1 shows, the monthly pattern of job growth in 2011. When the monthly totals are grouped into calendar quarters, distinct patterns emerge. In Q1 (Jan.-Mar.), private payrolls grew, and public payrolls held relatively steady, resulting in a net gain of 33,100 jobs. In Q2 (Apr.-Jun.), private growth turned negative, and sizable governmental losses occurred, leading to a net loss of 17,800 jobs. Private and public payrolls contracted by 6,400 positions in Q3 (Jul.-Sept.) with employment in both sectors rebounding by a combined 10,700 positions in Q4 (Oct.-Dec.). The net result was an annual gain of 19,600 jobs.
The private-sector gains logged during 2011 did not occur uniformly across industries (fig. 2). The leisure and hospitality services sector grew the most in absolute and relative terms (+11,800 jobs, +3 percent), due overwhelmingly to net growth in the accommodation and food service sub-sector (+10,600 jobs, +3.1 percent). Put differently, 36.1 percent of all the private-sector jobs that North Carolina netted in 2011 were at lodging establishments, restaurants, bars, limited-service eating establishments, food service contractors, catering firms, and mobile food vendors.
 The next fastest growing private industry sector, again in both absolute and relative terms, was trade, transportation, warehousing, and utilities, which netted 9,200 positions (+1.3 percent), thanks to the addition of 9,000 jobs in retail trade (+2.1 percent). Education and health services added 7,000 more positions than it lost (+1.3 percent) with the gains split almost equally between the educational services and health care and social services sub-sectors. Professional and business services added 4,000 jobs (+0.8 percent); declines in professional, scientific, and technical services were offset by gains in the corporate management sub-sector and the administrative and waste management sub-sector, which is the sector that encompasses temporary help services.
In terms of contracting industries, information lost the most jobs in absolute and relative terms (-1,100 jobs, -1.6 percent), followed by finance (-1,000 jobs, -0.5 percent). The losses in finance stemmed from cuts in the real estate and rental leasing sub-sector (-2,000 jobs, -4.1 percent). Construction and manufacturing payrolls both were flat over the year. In manufacturing, the loss of 5,100 jobs in non-durable manufacturing erased most of a gain of 5,300 jobs in durable manufacturing.
Note that the industrial growth trends seen during 2011 are inconsistent with the notion that unemployment is the product of mismatches between workforce skills and job requirements. Some 78.9 percent of net private-sector growth occurred in accommodation and food services, retail trade, and administrative and waste management (including temporary help services); these are industries that generally employ significant numbers of workers with modest skill levels. Employment in industries that typically employ relatively more skilled workers (e.g., professional, scientific, and technical services; information; and manufacturing), in contrast, contracted.
Large Job Gap Remains
The weak job growth recorded during 2011 did little to replace the jobs lost earlier in the business cycle. Since the onset of the “Great Recession,” North Carolina has lost, on net, 295,300 positions, or 7.1 percent of its payroll employment base. The maximum job loss recorded during the business cycle occurred in February 2010, when the state had 323,000 fewer jobs (-7.7 percent) than it did 26 months before. Since that time, North Carolina has netted 27,700 positions (+0.7 percent), for an average monthly gain of nearly 1,300 jobs. While the state’s economy added more jobs in 2011 than in 2010 (+19,600 versus +5,400), the growth was too weak to materially alter the employment situation. Even if the annual level of job growth were to triple, it still would take roughly five years to close the current jobs gap, holding all else equal.
 As fig. 3 shows, the job losses recorded during the Great Recession have proven more severe than the ones experienced during the 2001 and 1990-1991 recessions. At the height of the 2001 recession, the state shed 4.5 percent of its jobs base, while the comparable drop during the 1990-1991 recession was 1.9 percent. In both of those recessions, the job gap began to steadily close after the peak job losses were realized. That has not happened during the current cycle. In fact, since December 2009, payroll employment in the state has grown by just 25,000 positions, which has succeeded in lowering the job gap by only 0.6 percentage points.
To further understand the magnitude of the job gap facing North Carolina, consider that the state ended 2011 with 11,700 fewer payroll jobs (-0.3 percent) than it had in December 1999. While the image of North Carolina as a state growing rapidly in terms of population and jobs was very much an accurate one in the late 1990s, it no longer holds. In fact, North Carolina has not recorded any net job growth over the past 12 years despite adding residents.
 Remember, too, that the job shortfall currently facing North Carolina is actually larger than the one caused by the destruction of jobs during the recession. Since December 2007, the number of working-age Tar Heels has increased by 362,100 (+5.2 percent) persons. This means that payroll employment in the state should have been growing at an average monthly rate of 0.11 percent per month just to keep pace with workforce growth. If one considers the jobs that should have been created over the last four years but were not, the gap facing the state is 518,000 positions (fig. 4). To close that gap by December 2015, holding all else equal, North Carolina would need to net 14,389 jobs per month for each of the next 36 months. At no point since 1990 has North Carolina sustained such a level of growth over so long a period.
Joblessness Remains Widespread
Weak job growth in 2011 did little to reduce the problems of unemployment and joblessness in North Carolina. The monthly number of unemployed Tar Heels (seasonally adjusted) averaged 449,679. Furthermore, the average number of unemployed persons rose over the year. On a quarterly basis, there was an average of 16,216 more unemployed persons (+3.7 percent) during 2011.Q4 than one year earlier.
In December 2011, the statewide unemployment rate equaled 9.9 percent, compared to 9.8 percent in December 2010. Throughout 2011, the monthly unemployment rate fluctuated between 9.7 and 10.5 percent. For the year, the average monthly rate was 10 percent, which represented an improvement over the 2010 average rate of 10.5 percent.
 When judged in terms of the statewide unemployment rate (seasonally unadjusted), the recent recession has proven to be the longest and most severe of any post-1980 downturn (fig. 5). Between 1980 and 2008, the highest unemployment rate recorded in North Carolina was 11.3 percent in March 1983. During the same 28-year period, the unemployment rate exceeded 10 percent on just four occasions, all in the early 1980s. Since February 2009, however, the seasonally-unadjusted unemployment rate has exceeded 10 percent in 24 of 34 months and has fallen no lower than 9.4 percent. And, the unemployment rate exceeded 11 percent in seven of those months and reached a high of 12.1 percent in early 2010.
In every other post-1980 recession, the state unemployment rate had returned to its pre-recessionary level by 42 months following the onset of the downturn. Despite the passage of 48 months since the onset of the last recession, North Carolina’s seasonally unadjusted unemployment rate of 9.8 percent remains twice as high as the December 2007 level of 4.9 percent.
More Problems Than Simple Unemployment
The size of the state’s civilian labor force (seasonally adjusted) increased during 2011. Between December 2010 and December 2011, the number of North Carolinians in the state’s labor force rose by 45,822 persons (+1 percent), climbing to 4.51 million from 4.46 million. Over the year, the number of employed individuals increased by 36,668 (+0.9 percent), which brought total employment to 4.06 million. The number of unemployed individuals rose by 9,154 individuals (+2.1 percent). Note that almost all of the labor force and employment growth occurred in the first half of the year. From December 2010 to June 2011, the labor force added 41,446 persons (+0.9 percent), but from June 2011 to December 2011, only 4,376 people joined the labor force (+0.01 percent).
 Labor force growth resulted from the entry of new individuals to the workforce and the re-entry of experienced workers. Unfortunately, the slight uptick in the size of the labor force that occurred in 2011 was insufficient to reverse the overall contraction in the size of the labor force that has occurred since 2007. In December 2011, North Carolina’s civilian labor force had 52,859 fewer members (-1.2 percent) than it did in December 2007, when the national recession began, and 49,746 fewer individuals (-1.1 percent) than was the case in February 2010, the month when the state’s labor market bottomed out (fig. 6). While part of that decline may be attributable to changes in the structure of the workforce (e.g., more people of retirement age), part is likely tied to the decision of frustrated job seekers to abandon their searches. This suggests that joblessness is more widespread than reflected in the official unemployment rate.
Estimates of the underemployment rate, a broader measure of labor under-utilization prepared by the US Bureau of Labor Statistics, indicate that 17.9 percent of North Carolina’s adjusted labor force was underemployed, on average, in 2011. That measure includes not only individuals who meet the formal definition of unemployment, but also those working part-time despite preferring full-time work and those marginally attached to the workforce. Over the year, the statewide underemployment rate rose by 0.5 percentage points, rising to 17.9 percent from a level of 17.4 percent in 2010.
 Regardless of the exact measure used, a sizable amount of labor in North Carolina is currently sitting idle. Nearly 10 of every 100 members of the state’s labor force are unemployed (seasonally adjusted), while almost 18 of every 100 are underemployed. Moreover, the share of adult North Carolinians with a job has fallen sharply since late 2007. In December 2011, only 55.6 percent of working-age North Carolinians (seasonally adjusted) had jobs, a level no different from the one posted one year prior. This rate actually fell to a low of 55.3 percent near the end of 2011.Q3. At no other time since 1976 has the employment-to-population been as low as it has been in recent months (fig. 7). The current ratio also is well below the historical average rate of 63.6 recorded between January 1976 and December 2007.
Similarly, the December 2011 labor force participation rate of 61.7 percent was tied for the second-lowest rate recorded since 1976. Prior to the Great Recession, the participation rate never had fallen below 65.1 percent and averaged 67.1 percent While some of that change is likely due to shifts in the age structure of the workforce, the recession has played a driving role. Over time, the degree to which the participation rate rebounds will influence the number of jobs needed to bring down unemployment. The higher the share, the more job growth that will be needed.
Geographic Patterns in Joblessness
During 2011, labor market conditions remained weak across North Carolina. In December 2011, 59 counties had unemployment rates of at least 10 percent, while 27 counties had unemployment rates at or above 12 percent. Compared to a year earlier, unemployment rates were higher in 68 counties, lower in 27 counties, and unchanged in five counties. (All local figures are seasonally unadjusted.)
Labor markets in non-metropolitan communities remained particularly weak. In December 2011, the unemployment rate in non-metropolitan North Carolina was 10.9 percent, no different from the rate recorded in December 2010. The metropolitan unemployment rate, meanwhile, rose over the course of the year, climbing to 9.4 percent from 9.2 percent. Meanwhile, 9.1 percent of the combined labor force residing in the “Big Three” metro areas of Charlotte, the Research Triangle, and the Piedmont Triad was unemployed; a year ago the figure was 9 percent.
Between the onset of the recession and December 2011, the size of North Carolina’s non-metro labor force declined by 46,460 individuals (-3.5 percent), while the metropolitan labor force gained 19,429 members (+0.6 percent). Within metro North Carolina, growth in the “Big Three” metros accounted for 84 percent of the total gain.
 As fig. 8 shows, the labor market performances of North Carolina’s metro areas varied over the year. Ten of the state’s 14 areas posted increases in their labor forces with the greatest gains occurring in the Fayetteville (+3.3 percent) and Greensboro (+1.9 percent) metros. In contrast, Wilmington’s labor force contracted by 2 percent, while the labor force shrank by 1.9 percent in the Hickory-Morganton-Lenoir metro. Since the start of the recession, the greatest rates of labor force growth have occurred in the military communities of Fayetteville (+7.5 percent) and Jacksonville (+6.5 percent), followed by Raleigh-Cary (+3.4 percent) and Durham-Chapel Hill (+2.7 percent).
At 7.5 percent, Durham had the lowest metro unemployment rate in December 2011. Next came Asheville (7.9 percent), followed by Raleigh-Cary (8 percent). The highest rates were in Rocky Mount (12.9 percent), Hickory (11.9 percent), and Charlotte-Gastonia-Rock Hill, NC-SC (10.3 percent).
When looking at local unemployment numbers, it is important to place them in perspective. The 7.5 percent unemployment rate found in the Durham metro, for instance, is low relative to the performance of other North Carolina metros, yet it is high by any objective standard. Consider how in December 2007 just 3.8 percent of Durham’s labor force was unemployed. Four years later, the area’s unemployment rate was 1.9 times greater, while the number of unemployed residents was 99.2 percent larger. Despite faring better than other metros in the state, Durham’s labor market hardly can be deemed robust.
Economic Hardships Continue to Mount
The lack of jobs continues to be the most serious problem facing working North Carolinians. During 2011, job openings remained scarce. While state-level information is not available, data from the US Bureau of Labor Statistics suggests that, in the South region, there were 3.4 unemployed workers for every job opening posted in December 2011. The regional job-seekers ratio rate improved over the year, dropping from 5:1, though the current level remains high by historical standards. In December 2007, for instance, there were 1.5 unemployed workers per job opening in the South, and in January 2001, there were 1.1 unemployed workers per job opening in the South.
Given the scarcity of job openings, it is not surprising that individuals who have lost jobs are experiencing extended periods of unemployment. In December 2011, 42.9 percent of all unemployed Americans had been jobless for at least six months, with the average spell of unemployment lasting 40.1 weeks. Unfortunately, the longer workers are unemployed, the less likely they are to secure new positions due to competition, skills deterioration, and stereotyping. If such trends continue, many of North Carolina’s long-term unemployed workers likely will never return to work.
 Perhaps the most troubling indicator of the economic hardships facing North Carolina’s households is the surge in the size of the state’s Food Stamp caseload. Between December 2010 and October 2011, the most recent month with data, the number of Tar Heels participating in the program grew by 7 percent, or 108,073 persons. (Note the 2011 data are influenced by the provision of emergency assistance following some natural disasters.) Much of the growth is attributable to job losses among individuals with modest incomes — job losses that pushed their household incomes below the program eligibility level (gross monthly income of 130 percent of the poverty level, or $2,422 for a four-person household). Moreover, since December 2007, the number of Tar Heels participating in the program has grown by 732,543 persons, or 79.2 percent (fig. 9). And, the number of program participants has increased by 25.7 percent since February 2010, the month in which the state’s labor market bottomed out. As a result, 17.6 percent of the state’s residents were connected to the food assistance program in October 2011.
Future Prospects
2011 proved to be another lost year for North Carolina’s labor market. Since job losses peaked in February 2010, North Carolina has netted just 27,700 payroll jobs (+0.7 percent). That rate of growth is insufficient to keep pace with the natural increase in the size of the state’s working-age population, to say nothing of replacing the jobs lost during the recession. While the private sector performed better than it has in recent years, payroll reductions in the public sector erased a third of the private-sector gain. Even if that had not occurred, the degree of expansion in the private sector still would have been insufficient to close the large job gap that opened earlier in the business cycle in any meaningful or perceptible way.
Unfortunately, there exists little evidence suggesting an imminent change from the status quo. While the worst of the public-sector job cuts linked to closing of an estimated $2.4 billion general fund budget gap for the biennium ending on June 30, 2013, likely is past, the state revenue situation remains tentative and highly dependent on improvements in employment conditions. More cuts therefore are possible in the upcoming short legislative session.
Additionally, fiscal contraction in the form of federal spending reductions and the expiration of stimulative policies like emergency unemployment compensation and the temporary cut in payroll taxes is likely to weigh on growth. And unfavorable international developments remain a concern. Though national economic conditions seemed to improve in late 2011, those strides were modest relative to the magnitude of the problems facing the labor market and are insufficient to return the labor market to health anytime soon.
If recent trends hold, North Carolina’s labor market will not grow robustly in 2012. Even if job growth in the private sector accelerates, it is unlikely to pick up enough to put much of a dent in the problems of unemployment and underemployment. Economic hardships therefore should remain pronounced across much of the state. For the long-term unemployed in particular, their odds of returning will continue to fall, yet the tattered state of the nation’s safety net means that little help will be available for such individuals and their families.
Absent significant changes in economic conditions and public policies, weak job growth, high levels of joblessness, and pervasive economic hardships appear to be in store for North Carolina, with 2012 apt to mark the fifth consecutive year of negative or minimal job growth.
###
Individuals with a printed copy of this analysis may access it online at http://www.sbnstrategies.com/?p=9798 or by scanning the QR code below.

All material within this analysis Copyright © 2012 South by North Strategies, Ltd. All rights reserved.
03.08.2011
Biannual Jobs Review, Policy Points
August 3, 2011- North Carolina’s labor market recorded virtually no net job growth during the first six months of 2011. Between December 2010 and June 2011, the state gained only 13,900 more payroll jobs than it lost (+0.4 percent). Though the private sector netted 27,000 positions, a net drop of 13,100 government jobs offset 48.5 percent of the private sector gain. With such weak growth, little progress was made against unemployment. Both the number of unemployed individuals and the share of the labor force that was unemployed rose during the first half of 2011. If current trends hold, 2011 will prove another lost year for working North Carolinians.
Little Progress on The Jobs Front
During the first half of 2011, business establishments in North Carolina added 13,900 more payroll jobs than they cut. The private sector drove that growth by netting 27,000 positions, while the public sector shed 13,100 more positions than it gained. Net declines in state (-10,300) and local (-2,700) government employment accounted for virtually all of the public sector contraction.
 As Figure 1 shows, the pattern of job growth in 2011 varied by calendar quarter. During Q1 (January – March), private payrolls grew, and public payrolls held relatively steady, resulting in a net gain of 33,100 jobs. In Q2 (April – June), private sector growth turned negative, and governmental losses accelerated. The result was a net loss of 19,200 jobs. Put differently, net losses in Q2 erased 58 percent of the Q1 gains. North Carolina therefore had just 0.4 percent more jobs in June 2011 than it did in December 2010.
 The private sector gains logged during early 2011 did not occur uniformly across industrial sectors (Figure 2). The trade, transportation, and warehousing sector grew the most in absolute and relative terms (+10,900, +0.3 percent), thanks to net growth in retail trade (+8,100). The next fastest growing sector was leisure and hospitality services, which netted 9,000 positions (+0.2 percent), due to growth in accommodation and food services. With the exception of other services, all of the remaining major private sector industries posted few changes in payroll levels. Among those industries, construction employment held steady, while manufacturing payrolls moved up 0.1 percent (+3,200 positions). The increase in manufacturing stemmed mainly from an uptick in durable goods manufacturing.
The growth trends recorded during the first half of 2011 are inconsistent with the idea that unemployment in North Carolina is due to mismatches between workforce skills and job requirements. The segments of the economy that commonly employ relatively less-skilled workers–segments like retail trade and food services–grew more robustly than many that employ comparatively higher-skilled workers. Within the professional and business services sector, growth occurred chiefly in the administrative and waste management sub-sector (which contains temporary help services), while employment in professional, scientific, and technical services fell.

Job Gap Widens in 2011
The weak job growth recorded during the first half of 2011 did little to replace the jobs lost between 2007 and 2009. Since the onset of the “Great Recession,” North Carolina has lost, on net, 301,000 positions, or 7.2 percent of its payroll base. The maximum job loss occurred in February 2010, when the state had 323,000 fewer jobs (-7.7 percent) than it did 26 months before. While North Carolina subsequently netted 22,000 jobs (+0.6 percent), the growth was too weak to materially alter the employment situation.
 As Figure 3 shows, the job losses recorded during the Great Recession have proven more severe than the ones experienced during the 2001 and 1990-1991 recessions. At the height of the 2001 recession, the state had shed 4.5 percent of its jobs base, while the comparable drop during the 1990-1991 recession was 1.9 percent. In both of those recessions, the job gap began to steadily close after the peak job losses were realized. That has not happened during the current cycle; rather, the job gap began to widen again during the second quarter of 2011.
 The job shortfall facing North Carolina actually is larger than the one caused by the destruction of jobs during the recession. Since December 2007, the number of working-age Tar Heels has increased by 324,600 (+4.7 percent). This means that the state should have added, on average, 4,800 positions each month just to keep pace with workforce growth. If one considers the jobs that should have been created yet were not, the gap facing the state is 501,800 jobs (Figure 4). To close the gap by June 2015, holding all else equal, North Carolina would need to net 13,939 jobs per month for each of the next 36 months. At no point since 1990 has North Carolina sustained such a level of growth over so long a period.
Joblessness Remains The Norm
Weak job growth during the first half of 2011 did little to reduce the problems of unemployment and joblessness in North Carolina. The monthly number of unemployed Tar Heels (seasonally adjusted) averaged 438,116 with the average actually increasing somewhat from the first to second quarter. In June, 9.9 percent of the state’s labor force was unemployed, up from 9.8 percent in December 2010. Throughout 2011, the unemployment rate has fluctuated between 9.7 and 9.9 percent.
 When judged in terms of the statewide unemployment rate (seasonally unadjusted), the recent recession has proven to be the longest and most severe of any post-1980 downturn (Figure 5). Between 1980 and 2008, the highest unemployment rate recorded in North Carolina was 11.3 percent in March 1983. During the same 28-year period, the unemployment rate exceeded 10 percent on just four occasions, all during the early 1980s. Since February 2009, however, the unemployment rate has exceeded 10 percent in 22 of 28 months and has ranged between 9.4 and 12.1 percent.
In every other post-1980 recession, the state unemployment rate had returned to its pre-recessionary level by 42 months following the onset of the recession. Such a decline has yet to occur during this business cycle. In June 2011, the statewide unemployment rate of 10.4 percent was just 0.2 percentage points lower than the level posted one year before. To return to the same 4.9 percent rate recorded in June 2007, North Carolina’s unemployment rate would need to fall by another 5.5 percentage points.
More Than Unemployment
The size of the state’s civilian labor force (seasonally adjusted) increased during the first half of 2011. Between December 2010 and June 2011, the number of North Carolinians in the state’s labor force rose by 40,360 (+0.9 percent), climbing to 4.50 million from 4.46 million. During that period, the number of employed individuals increased by 31,231 (+0.8 percent), bringing total employment to 4.06 million. The number of unemployed individuals rose by 9,129 individuals (+2.1 percent). Labor force growth resulted from the entrance of individuals entering the workforce for the first time and the re-entry of experienced workers.
 Unfortunately, the slight uptick in the size of the labor force was insufficient to reverse the overall contraction in the size of the labor force that has occurred since 2007. In June 2011, North Carolina’s civilian labor force had 17,970 fewer members (-0.4 percent) than it did in June 2010 (Figure 6) and 58,321 fewer individuals (-1.3 percent) than it did in December 2007. While part of that decline may be attributable to changes in the structure of the workforce (e.g., more people of retirement age), part is likely due to the decision of frustrated job seekers to abandon their searches. This suggests that joblessness is more widespread than reflected in the official unemployment rate.
Estimates of the underemployment rate, a broader measure of labor under-utilization prepared by the U.S. Bureau of Labor Statistics, indicate that 17.5 percent of North Carolina’s adjusted labor force was underemployed, on average, between the third quarter of 2010 (July – September) and the second quarter of 2011. That measure includes not only individuals who meet the formal definition of unemployment, but also those working part-time despite preferring full-time work and those marginally attached to the workforce. The most recent statewide underemployment rate was down only slightly from the 17.8 percent rate recorded between the third quarter of 2009 and the second quarter of 2010.
 Regardless of the exact measure used, a sizable amount of labor in North Carolina currently is sitting idle. Approximately 10 out of every 100 members of the state’s labor force are unemployed (seasonally adjusted), while nearly 18 out of every 100 are underemployed. Moreover, the share of adult North Carolinians with a job has fallen sharply over the course of the most recent recession. In June 2011, only 55.8 percent of working-age North Carolinians (seasonally adjusted) had jobs, up slightly from the 55.6 percent rate recorded in December 2010. At no other point since 1976 has the employment-to-population been as low as it has been in recent months (Figure 7). The current ratio also is well below the historical average of 63.5 recorded between January 1976 and December 2007.
Similarly, the June 2011 labor force participation rate of 61.9 percent is the fourth lowest recorded since 1976. Prior to the Great Recession, the participation rate never had fallen below 65.1 percent. While some of that change is likely due to shifts in the age structure of the workforce, the recession has played a driving role. Over time, the degree to which the participation rate rebounds will influence the number of jobs needed to bring down unemployment. The higher the share, the more job growth that will be needed.
Geographic Patterns in Joblessness
During the first half of 2011, labor market conditions remained weak across North Carolina. In June 2011, 68 counties had unemployment rates of at least 10 percent, while 26 counties had unemployment rates at or above 12 percent. Compared to a year earlier, unemployment rates were higher in 43 counties, lower in 52 counties, and unchanged in five counties. (Note: All local figures are seasonally unadjusted, and for the sake of data comparability, this section generally considers year-over-year changes.)
Labor markets in non-metropolitan communities remain particularly weak. In June 2011, the unemployment rate in non-metropolitan North Carolina was 11.3 percent, down from the 11.6 percent rate posted a year earlier. The metropolitan unemployment rate also dropped over the course of the year, falling to 10 percent from 10.2 percent. Meanwhile, 9.8 percent of the labor force residing in the “Big Three” metro areas of Charlotte, the Triangle, and the Triad was unemployed; a year ago the figure was 10.1 percent.
Between the onset of the recession and June, the size of North Carolina’s non-metro labor force declined by 27,253 individuals (-2.0 percent), while the metropolitan labor force gained 50,326 members (+1.6 percent). Within metro North Carolina, growth in the “Big Three” metros accounted for 54.5 percent of the total gain.
 As Figure 8 shows, the labor market performances of North Carolina’s metro areas have varied over the year. Eleven of the state’s 14 areas posted declines in their labor forces with the greatest drops occurring in the Hickory-Morganton-Lenoir (-3.2 percent) and Goldsboro (-2.2 percent) metros. Since the start of the recession, the greatest rates of labor force growth have occurred in the military communities of Jacksonville (+8.1 percent) and Fayetteville (+7.3 percent), followed by Raleigh-Cary (+3.8 percent).
At 8 percent, Durham had the lowest metro unemployment rate in June 2011. The next lowest rate was found in Asheville (8.2 percent), followed by Raleigh-Cary (8.5 percent). The highest rates were in Rocky Mount (13.7 percent), Hickory (12.5 percent), and Charlotte-Gastonia-Rock Hill (11.2 percent).
When looking at local unemployment numbers, it is important to place the numbers in perspective. The 8 percent unemployment rate found in the Durham metro, for example, is low relative to the performance of other North Carolina metros yet is high by any objective standard. Consider how in December 2007 just 3.8 percent of Durham’s labor force was unemployed; 3.5 years later, the area’s unemployment rate was 2.1 times greater, while the number of unemployed residents was 112.8 percent larger. Despite faring better than other metros in the state, Durham’s labor market hardly can be considered healthy.
Economic Hardships Continue to Mount
The lack of jobs continues to be the most serious problem facing working North Carolinians. During the first half of 2011, job openings remained scarce. While state-level information is not available, data from the U.S. Bureau of Labor Statistics suggests that, in the South region, there were 4.8 unemployed workers for every job opening posted in May 2011. In short, there simply were no jobs available for nearly four of every five unemployed Southerners. If the Southern economy had the same number of job openings in May 2011 as existed in May 2007, there would have been 773,000 more job openings and only 2.7 unemployed workers per job opening.
Given the scarcity of job openings, it is not surprising that individuals who have lost jobs are experiencing extended periods of unemployment. In June 2011, the average spell of unemployment spell in the United States was 39.9 weeks. Unfortunately, the longer workers are unemployed, the less likely they are to secure new positions due to competition, skills deterioration, and stereotyping. In fact, recent research has found that some employers are now explicitly refusing to consider unemployed job candidates. If such trends continue, many of North Carolina’s long-term unemployed likely will never return to work.
 Perhaps the most troubling indicator of the economic hardships facing North Carolina’s households is the surge in the size of the state’s Food Stamp caseload. Between December 2010 and April 2011, the most recent month for which data are available, the number of North Carolinians participating in the program grew by 1.5 percent. Much of the growth is attributable to job losses among individuals with modest incomes — job losses that pushed their household incomes below the eligibility level (gross monthly income of 130 percent of the poverty level or $2,389 for a four-person household). Moreover, since December 2007, the number of Tar Heels participating in the program has grown by 70.2 percent (Figure 9). As of April 2011, some 16.5 percent of the state’s residents were connected to the food assistance program.
Second Half Prospects
Halfway through 2011, North Carolina’s labor market appears headed toward another lost year. Since job losses peaked in February 2010, North Carolina has netted just 22,000 payroll jobs (+0.6 percent). That rate of growth is insufficient to keep pace with the natural increase in the size of the state’s working-age population, to say nothing of replacing the jobs lost during the recession.
Unfortunately, it is unlikely that the rate of job growth will accelerate in the second half of 2011. The reductions in state and local government payrolls resulting from the latest round of budget cuts should cause the public sector to drag on employment growth. Similarly, the spending cuts tied to the recent deal pertaining to the federal debt ceiling also should weigh on growth, as should the scheduled expiration of the remaining elements of the Recovery Act, the temporary cut in payroll taxes, and emergency unemployment compensation (Note: If the program lapses, workers losing jobs after July 1 will not receive emergency benefits). Recent data from the private sector also have been troubling and inconsistent with the idea of a rapid bounce back. International instability further clouds the situation.
If recent trends hold, North Carolina’s labor market will not add many jobs in the second half of the year. Even if net job growth remains positive, it likely will be too weak to put much of a dent in the problems of unemployment and underemployment. Economic hardships therefore should remain pronounced. For the long-term unemployed in particular, their odds of returning to work probably will fall, yet the tattered state of the nation’s safety net means that little help will be available for such individuals and their families.
Absent significant changes in public policies, weak job growth, high levels of joblessness, and mounting economic hardships appear to be in store for North Carolina during the second half of 2011.
###
Individuals with a printed copy of this analysis may retrieve it online by visiting http://www.sbnstrategies.com/?p=7712 or by scanning the Quick Response code below.

All material within this analysis Copyright © 2011 South by North Strategies, Ltd.
All rights reserved.
30.12.2010
Biannual Jobs Review, In the News, Policy Points, Publications
North Carolina’s labor market ended 2010 little changed from the start of the year. Between December 2009 and November 2010, the most recent month for which data are available, payroll employment in North Carolina rose by just 1,400 positions (+0.04 percent). While the number of unemployed Tar Heels and the the statewide unemployment rate fell during the year, much of the decline was due to a troubling contraction in the size of the state’s labor force. And, little evidence suggests that a robust jobs recovery will take hold in early 2011.
One Year, Two Job Markets
North Carolina’s labor market underwent two distinct phases in 2010 (figure, below). The first half of the year was a time of weak but positive growth. Between January and June, net job growth averaged 6,500 positions per month.  Total employment increased at a rate of 0.2 percent per month, while the number of unemployed individuals fell at a monthly rate of 1.5 percent. The labor force also grew at a monthly rate of 0.03 percent. The statewide unemployment rate, meanwhile, fell to 10 percent from 11.1 percent.
Much of that progress was the by-product of public policy supports provided by the federal government through the American Recovery and Reinvestment Act and related initiatives like the homebuyer tax credit and temporary hiring for the 2010 Census. As those supports faded away during the second half of 2010, North Carolina’s labor market sputtered.
Between July and November, net job loss in the state averaged 7,500 positions per month. Total employment fell at a rate of 0.2 percent per month, while the number of unemployed individuals fell at a monthly pace of 0.4 percent. Yet the labor force also contracted at a a monthly rate of 0.2 percent. The statewide unemployment rate, meanwhile, stagnated at a level fluctuating between 9.6 and 9.8 percent.
read more

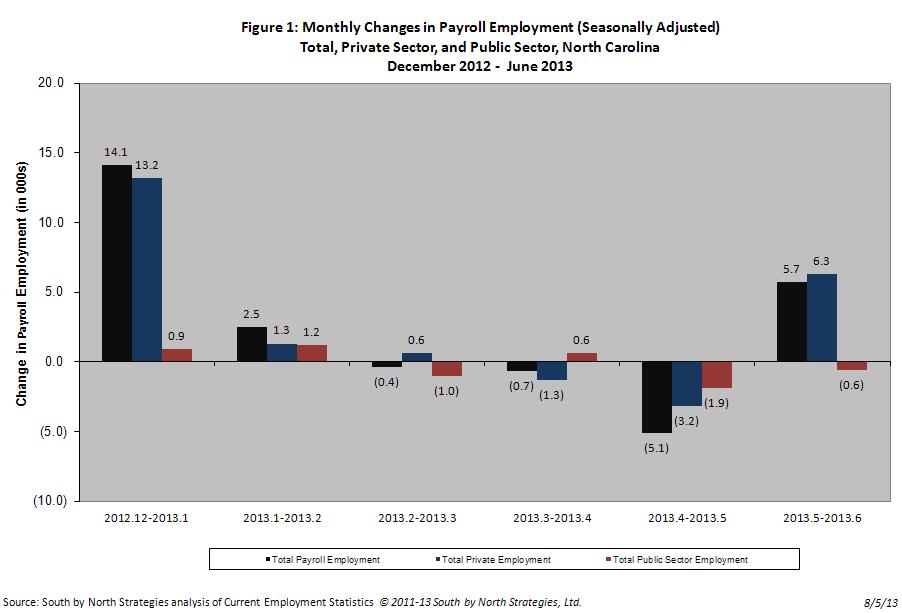
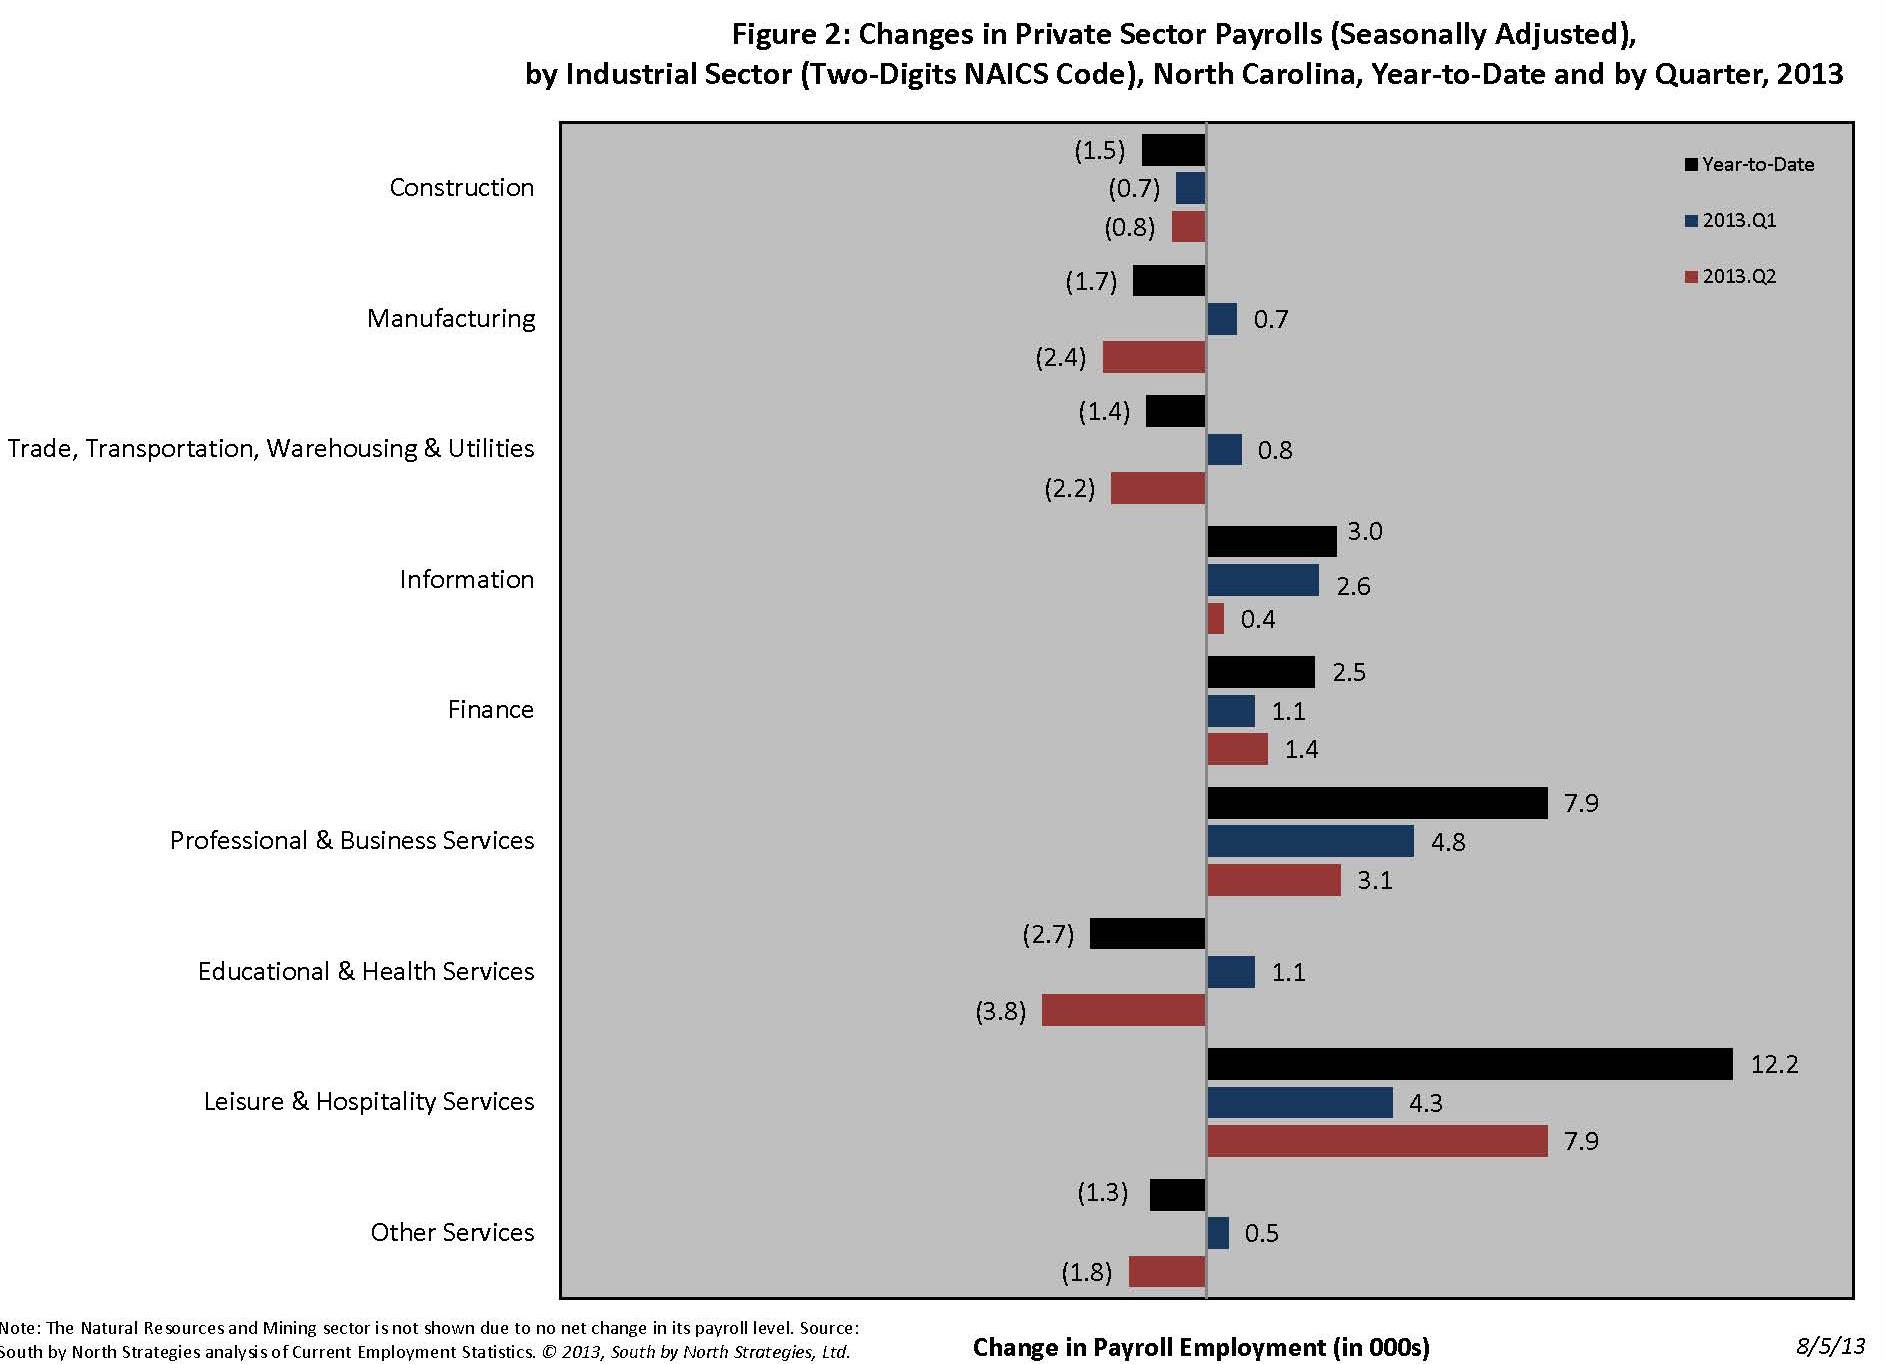
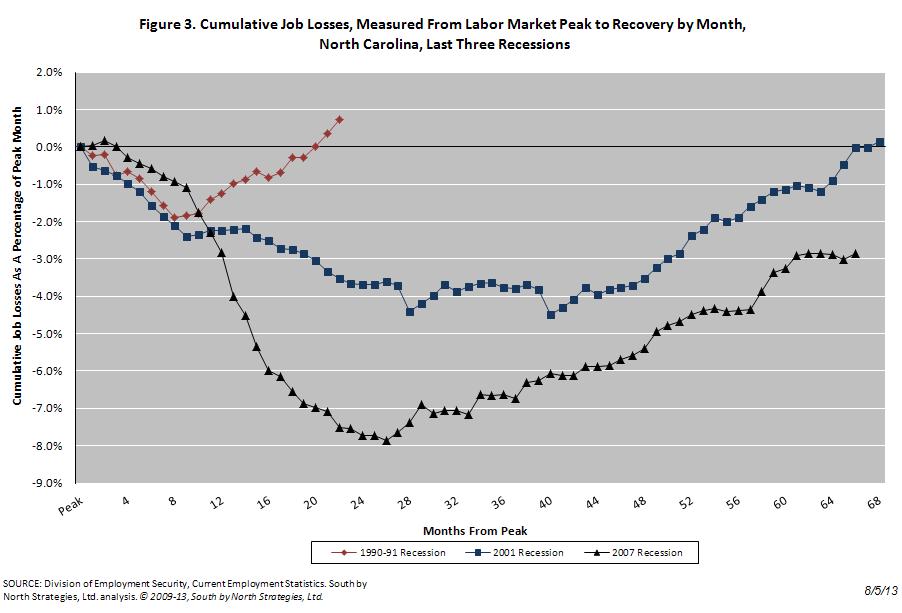
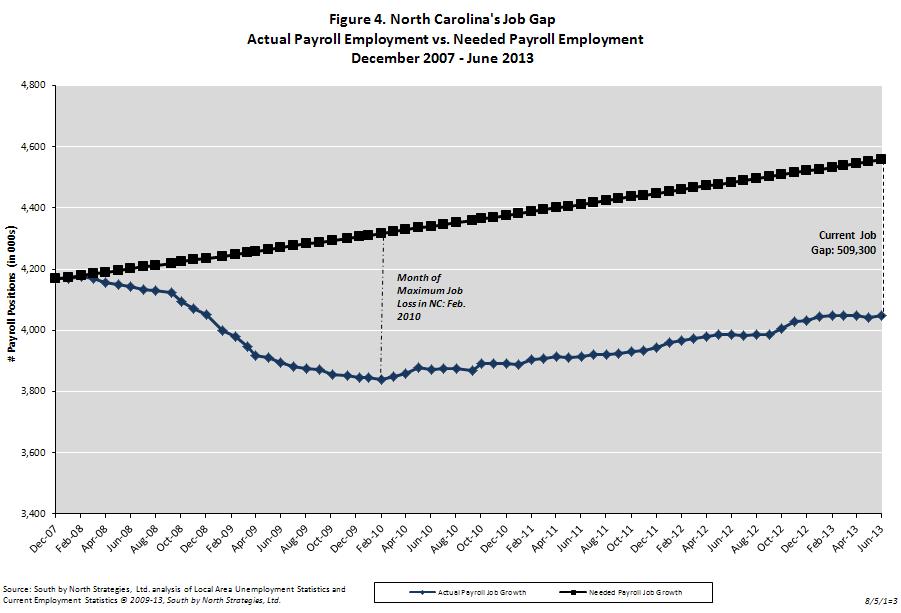
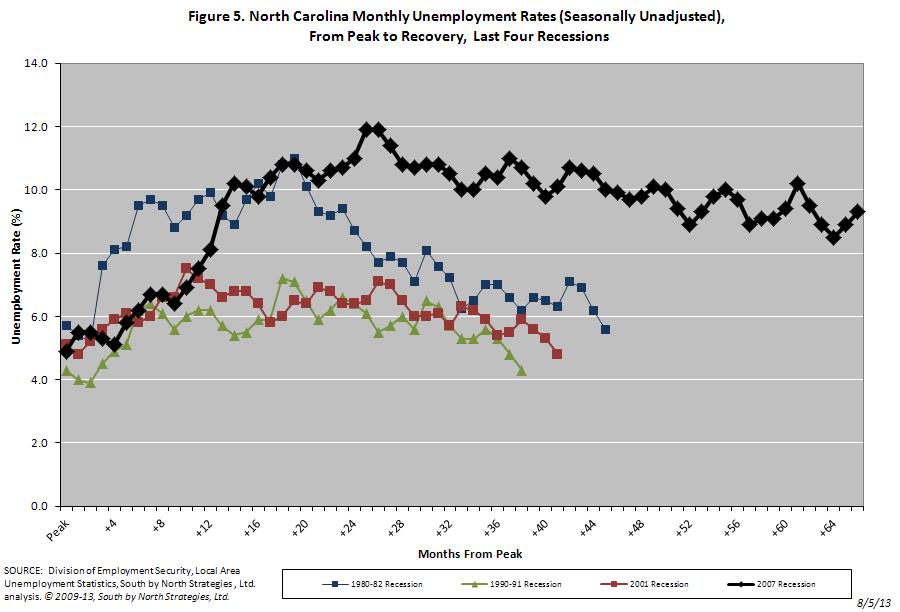
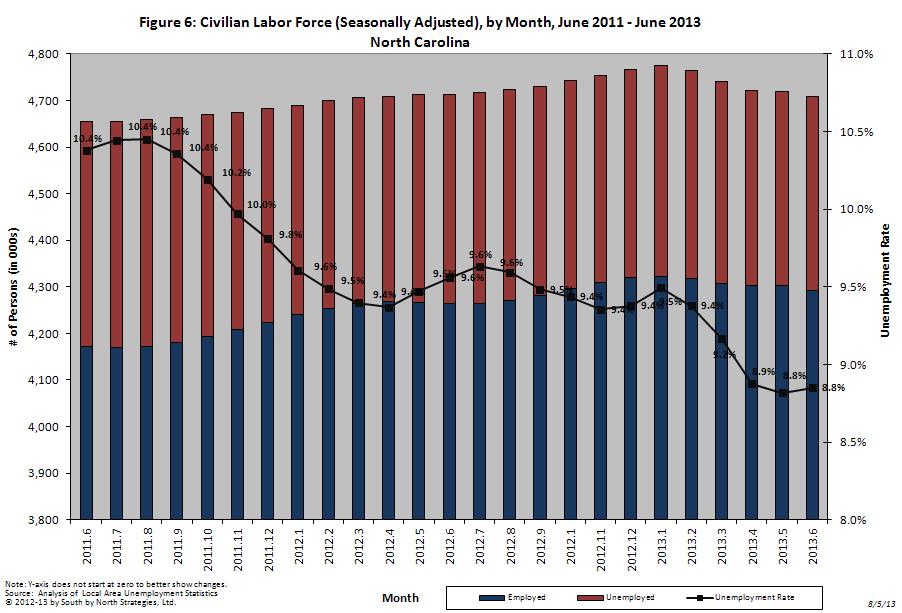
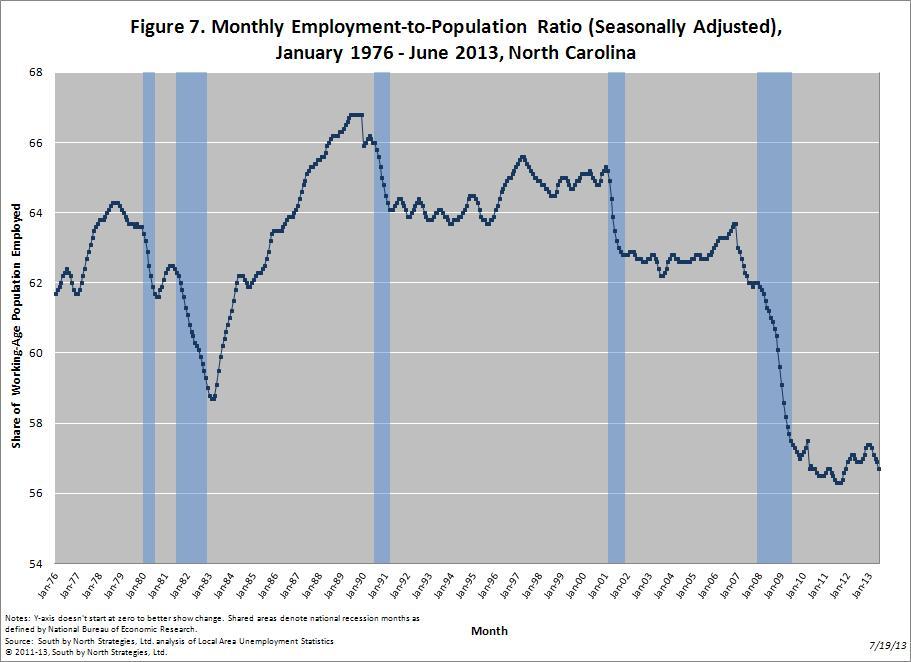
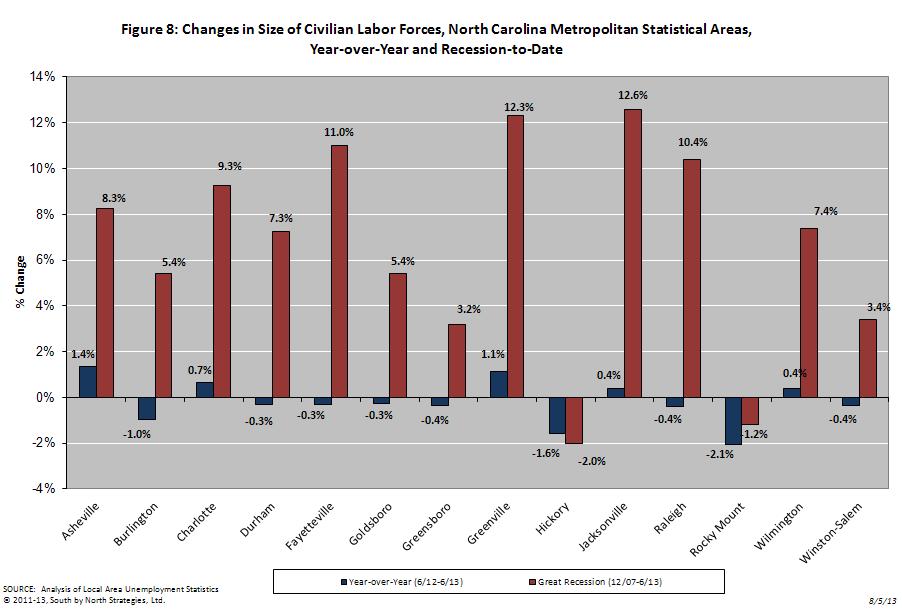


 Email Sign-Up