

NC Unemployment Claims: Week Of 3/28/15
For the benefit week ending on March 28, 2015, North Carolinians filed some 3,791 initial claims for state unemployment insurance benefits and 35,573 claims for state-funded continuing benefits. Compared to the prior week, there were fewer initial claims and fewer continuing claims. These figures come from data released by the US Department of Labor.
Averaging new and continuing claims over a four-week period — a process that helps adjust for seasonal fluctuations and better illustrates trends — shows that an average of 4,155 initial claims were filed over the previous four weeks, along with an average of 37,394 continuing claims. Compared to the previous four-week period, the average number of initial claims was lower, and the average number of continuing claims was lower.
One year ago, the four-week average for initial claims stood at 5,000, and the four-week average of continuing claims equaled 62,840.
In recent months covered employment has increased and now exceeds the level recorded a year ago (3.94 million versus 3.87 million). Nevertheless, there are still fewer covered workers than there were in January 2008, which means that payrolls are smaller today than they were more than seven years ago.
The graph (below right) shows the changes in unemployment insurance claims measured as a share of covered employment in North Carolina since the recession’s start in December 2007.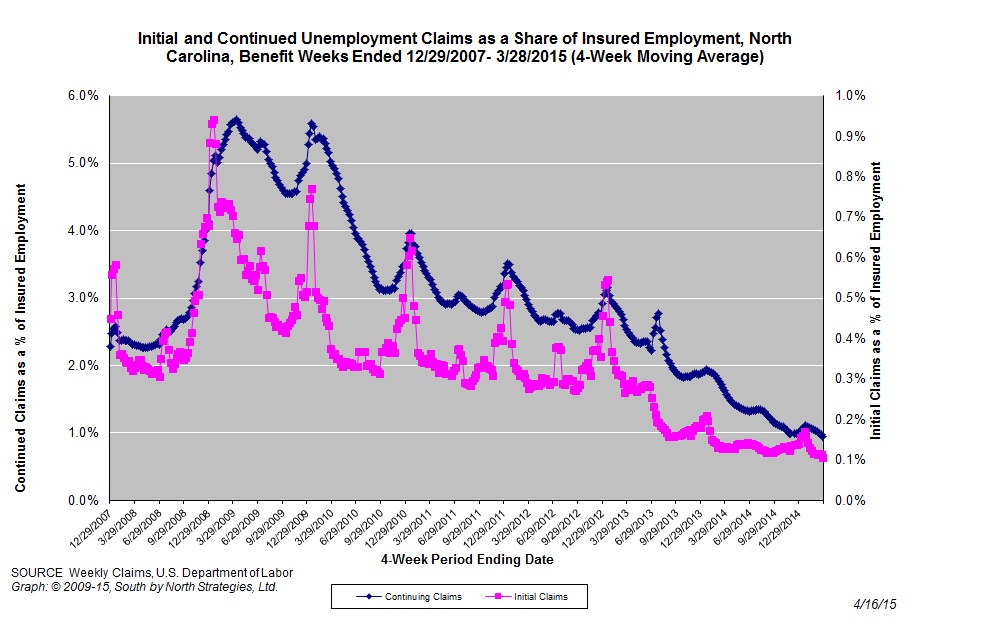
Both new and continuing claims have peaked for this cycle, and the four-week averages of new and continuing claims have fallen considerably. The four-week average of initial claims, when measured as a share of covered employment, is at the lowest level recorded since early 2008, while the four-week average of continuing claims is at the lowest level recorded since early 2008.
Note that the recent year-over-year declines in new and continuing claims are not necessarily indicative of an improving labor market. State legislation that took effect on July 1, 2013, made major changes to insurance eligibility criteria, and the more stringent criteria eliminate claims that would have been valid prior to July 1, 2013. Additionally, the legislation reduced the maximum number of weeks of state-funded insurance for which a claimant is eligible — an action that reduces the number of continuing claims.
To place the numbers in context, consider how the four-week average of initial claims (4,155) was 16.5 percent lower than the figure recorded one year ago (5,000), while the average number of continuing claims was 40.5 percent lower (37,394 versus 62,840). Given the modest rate of job growth that has occurred in North Carolina over the past year, such declines likely are, at least in part, products of changes to unemployment insurance laws rather than improvements in underlying economic conditions.
NC Unemployment Claims: Week Of 3/21/15
For the benefit week ending on March 21, 2015, North Carolinians filed some 4,149 initial claims for state unemployment insurance benefits and 37,029 claims for state-funded continuing benefits. Compared to the prior week, there were fewer initial claims and fewer continuing claims. These figures come from data released by the US Department of Labor.
Averaging new and continuing claims over a four-week period — a process that helps adjust for seasonal fluctuations and better illustrates trends — shows that an average of 4,499 initial claims were filed over the previous four weeks, along with an average of 38,677 continuing claims. Compared to the previous four-week period, the average number of initial claims was lower, and the average number of continuing claims was lower.
One year ago, the four-week average for initial claims stood at 4,972, and the four-week average of continuing claims equaled 64,499.
In recent months covered employment has increased and now exceeds the level recorded a year ago (3.94 million versus 3.87 million). Nevertheless, there are still fewer covered workers than there were in January 2008, which means that payrolls are smaller today than they were more than seven years ago.
The graph (below right) shows the changes in unemployment insurance claims measured as a share of covered employment in North Carolina since the recession’s start in December 2007.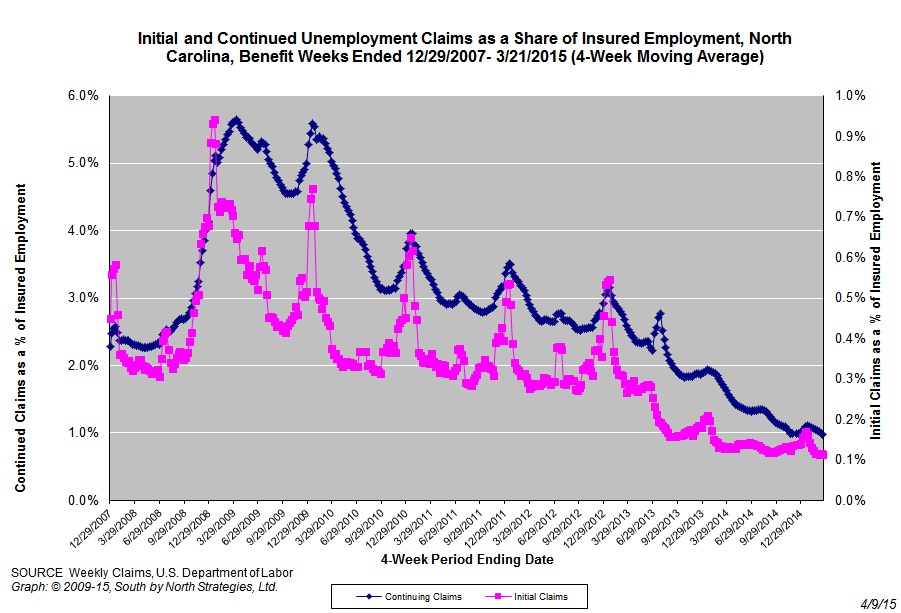
Both new and continuing claims have peaked for this cycle, and the four-week averages of new and continuing claims have fallen considerably. The four-week average of initial claims, when measured as a share of covered employment, is at the lowest level recorded since early 2008, while the four-week average of continuing claims is at the lowest level recorded since early 2008.
Note that the recent year-over-year declines in new and continuing claims are not necessarily indicative of an improving labor market. State legislation that took effect on July 1, 2013, made major changes to insurance eligibility criteria, and the more stringent criteria eliminate claims that would have been valid prior to July 1, 2013. Additionally, the legislation reduced the maximum number of weeks of state-funded insurance for which a claimant is eligible — an action that reduces the number of continuing claims.
To place the numbers in context, consider how the four-week average of initial claims (4,499) was 9.5 percent lower than the figure recorded one year ago (4,972), while the average number of continuing claims was 40.8 percent lower (38,677 versus 64,499). Given the modest rate of job growth that has occurred in North Carolina over the past year, such declines likely are, at least in part, products of changes to unemployment insurance laws rather than improvements in underlying economic conditions.
A Slow Start For North Carolina’s Job Market
CHAPEL HILL, NC (March 17, 2015) – In January, employers in North Carolina added no more payroll positions than they cut, as a small gain in private-sectors payrolls was offset entirely by a small drop in public-sector payrolls. The monthly household survey, meanwhile, recorded no major changes in the total number of unemployed North Carolinians or in the statewide unemployment rate, which held steady at 5.4 percent.
These findings come from new data released today by the Labor and Economic Analysis Division of the NC Department of Commerce.
“The first month of 2015 was a relatively uneventful one for North Carolina’s labor market,” said John Quinterno, a principal with South by North Strategies, Ltd., a research firm specializing in economic and social policy. “During the course of 2014, North Carolina gained 98,900 more jobs than it lost, but even with those gains, the state ended the year with just 35,100 more payroll jobs, for a total of 0.8 percent more jobs, than it had seven years earlier.”
Between December 2014 and January 2015, North Carolina employers added no more payroll jobs than they cut. Private-sector payrolls added, on net, 2,000 positions (+0.1 percent), but public-sector payrolls lost, on net, 2,000 jobs (-0.3 percent). Within private industry, the trade, transportation, and utilities sector shed the most jobs (-11,700, -1.5 percent), while the leisure and hospitality sector netted the most jobs (+5,200, +1.2 percent). Payroll levels in most every other major industrial sector either rose or held steady between December and January.
A revision to the December payroll data found that the state lost rather than gained jobs that (-500 jobs versus an original estimate of +15,100 jobs). With that revision, North Carolina now has, on net, just 35,100 more payroll positions (+0.8 percent) than it did in December 2007. Since bottoming out in February 2010, the state’s labor market has netted an average of 6,168 payroll jobs per month, resulting in a cumulative gain of 363,900 positions (+9.5 percent).
“Revisions to the 2014 data reveal that North Carolina netted fewer jobs over the course of the year than first reported,” noted Quinterno. “Initial estimates suggested that the number of payroll jobs in the state expanded by 2.8 percent, or 114,500 positions, over the course of the year. After revisions, however, the state netted 98,900 jobs, for a gain of 2.4 percent. That growth rate was slightly greater than the one of 2.1 percent logged in 2013.”
“The fact that North Carolina now has slightly more payroll jobs than it did seven years ago does not mean that the state’s labor market has recovered,” cautioned Quinterno. “Over that time, North Carolina needed to replace the jobs lost during the recession and add jobs to keep pace with the growth of the working-age population. Depending on the assumptions used, North Carolina is anywhere from 200,000 to 400,000 payroll jobs short of the number of jobs it should have added since late 2007 to keep pace with population growth.”
The household data recorded in January also pointed to few changes in the statewide labor market. Last month, the statewide unemployment rate held steady at 5.4 percent, which was the lowest rate recorded since early 2008. Over the course of 2014, the unemployment rate fell by 1.3 percentage points, while the number of unemployed persons decreased by 62,060, or 19.9 percent. Over that same period, the number of employed persons rose by 46,906 (+1.1 percent), while the size of the labor force fell by 15,154 persons (-0.3 percent). As an aside, the size of North Carolina’s labor force has held steady at between 4.6 and 4.7 million persons since early 2010.
Over the course of 2014, some 24.4 percent of the decline in the number of unemployed North Carolinians was attributable mathematically to people who left the labor force entirely rather than to those who became employed. If those 15,154 leavers from the labor force were added back and considered unemployed, the statewide unemployment rate in December would have equaled 5.7 percent, Even if half of those individuals were added back to the labor force and considered unemployed, the statewide unemployment rate would have equaled 5.6 percent.
Year-over-year declines in the statewide labor force participation rate provide additional evidence of a labor market with problematic underlying dynamics. In December, the share of working-age North Carolinians participating in the labor market was 59.8 percent, which was lower than the 60.7 percent figure logged a year ago, not to mention the lowest monthly rate recorded at any time since January 1976.
In addition, another important measure of labor utilization, the employment-to-population ratio, fell over the year, dropping to 56.6 percent from 56.7 percent. The current share of working-age North Carolinians with a job now is just slightly above the lowest rate logged at any point since 1976 (56.3 percent).
Labor market data for 2014 provide additional insight into the effects of the extensive changes to the state’s system of unemployment insurance implemented in July 2013. During 2014, the year, the number of claimants of regular state-funded insurance fell by 47.8 percent, dropping to 31,806 from 60,889. Also in December, the state paid a (nominal) total of $27.6 million in regular state-funded unemployment insurance compensation, an amount 53.3 percent lower than the (nominal) total of $59.1 million paid in December 2013.
“North Carolina netted jobs in 2014 at a rate faster than those posted in recent years, but even with those gains, the state’s labor market is in no way, shape, or form recovered from the last recession,” explained Quinterno. “North Carolina ended 2014 with just 0.8 percent more jobs than it had seven years earlier, and the state had 9.5 percent more unemployed residents and an unemployment rate that was 0.4 percentage points higher. And a smaller share of the working-age population was participating in the labor force than at any point in almost 40 years.”
“North Carolina’s labor market started 2015 the same way it ended 2014: mired in a painfully slow recovery that simply is not generating enough jobs, fast enough to accommodate all those who want and need work,” said Quinterno. “In many ways, the state’s labor market began 2014 stuck in the same low gear where it has spent most of the past five years.”
An Orientation To Labor Market Information
In March 2015, South by North Strategies led “An Orientation to Labor Market Information for Workforce & Economic Development Professionals.” Developed for the Southeastern Employment and Training Association‘s Spring Conference, an event held in Greensboro, NC, the training session provided development professionals with an overview of essential labor market concepts and data sources.
NC Unemployment Claims: Week Of 2/21/2015
For the benefit week ending on February 21, 2015, North Carolinians filed some 4,463 initial claims for state unemployment insurance benefits and 39,929 claims for state-funded continuing benefits. Compared to the prior week, there were more initial claims and fewer continuing claims. These figures come from data released by the US Department of Labor.
Averaging new and continuing claims over a four-week period — a process that helps adjust for seasonal fluctuations and better illustrates trends — shows that an average of 4,616 initial claims were filed over the previous four weeks, along with an average of 41,192 continuing claims. Compared to the previous four-week period, the average number of initial claims was lower, and the average number of continuing claims was lower.
One year ago, the four-week average for initial claims stood at 5,562, and the four-week average of continuing claims equaled 71,672.
In recent months covered employment has increased and now exceeds the level recorded a year ago (3.94 million versus 3.87 million). Nevertheless, there are still fewer covered workers than there were in January 2008, which means that payrolls are smaller today than they were roughly seven years ago.
The graph (below right) shows the changes in unemployment insurance claims measured as a share of covered employment in North Carolina since the recession’s start in December 2007.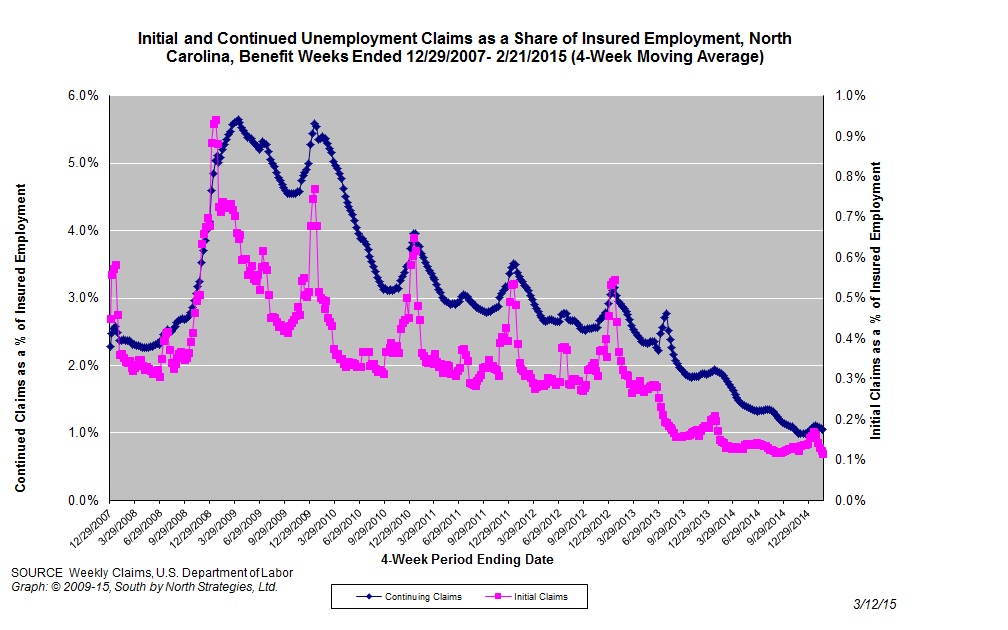
Both new and continuing claims have peaked for this cycle, and the four-week averages of new and continuing claims have fallen considerably. The four-week average of initial claims, when measured as a share of covered employment, is at the lowest level recorded since early 2008, while the four-week average of continuing claims is somewhat above the lowest level recorded since early 2008.
Note that the recent year-over-year declines in new and continuing claims are not necessarily indicative of an improving labor market. State legislation that took effect on July 1, 2013, made major changes to insurance eligibility criteria, and the more stringent criteria eliminate claims that would have been valid prior to July 1, 2013. Additionally, the legislation reduced the maximum number of weeks of state-funded insurance for which a claimant is eligible — an action that reduces the number of continuing claims.
To place the numbers in context, consider how the four-week average of initial claims (4,616) was 17 percent lower than the figure recorded one year ago (5,562), while the average number of continuing claims was 42.5 percent lower (41,192 versus 71,672). Given the modest rate of job growth that has occurred in North Carolina over the past year, such declines likely are, at least in part, products of changes to unemployment insurance laws rather than improvements in underlying economic conditions.
 Email Sign-Up