

NC Unemployment Claims: Week Of 2/14/15
For the benefit week ending on February 14, 2015, North Carolinians filed some 3,866 initial claims for state unemployment insurance benefits and 40,863 claims for state-funded continuing benefits. Compared to the prior week, there were fewer initial claims and fewer continuing claims. These figures come from data released by the US Department of Labor.
Averaging new and continuing claims over a four-week period — a process that helps adjust for seasonal fluctuations and better illustrates trends — shows that an average of 4,857 initial claims were filed over the previous four weeks, along with an average of 42,066 continuing claims. Compared to the previous four-week period, the average number of initial claims was lower, and the average number of continuing claims was lower.
One year ago, the four-week average for initial claims stood at 5,651, and the four-week average of continuing claims equaled 72,516.
In recent months covered employment has increased and now exceeds the level recorded a year ago (3.94 million versus 3.89 million). Nevertheless, there are still fewer covered workers than there were in January 2008, which means that payrolls are smaller today than they were roughly seven years ago.
The graph (below right) shows the changes in unemployment insurance claims measured as a share of covered employment in North Carolina since the recession’s start in December 2007.
Both new and continuing claims have peaked for this cycle, and the four-week averages of new and continuing claims have fallen considerably. The four-week average of initial claims, when measured as a share of covered employment, is at the lowest level recorded since early 2008, while the four-week average of continuing claims is somewhat above the lowest level recorded since early 2008.
Note that the recent year-over-year declines in new and continuing claims are not necessarily indicative of an improving labor market. State legislation that took effect on July 1, 2013, made major changes to insurance eligibility criteria, and the more stringent criteria eliminate claims that would have been valid prior to July 1, 2013. Additionally, the legislation reduced the maximum number of weeks of state-funded insurance for which a claimant is eligible — an action that reduces the number of continuing claims.
To place the numbers in context, consider how the four-week average of initial claims (4,857) was 14.1 percent lower than the figure recorded one year ago (5,651), while the average number of continuing claims was 42 percent lower (42,066 versus 72,516). Given the modest rate of job growth that has occurred in North Carolina over the past year, such declines likely are, at least in part, products of changes to unemployment insurance laws rather than improvements in underlying economic conditions.
NC Unemployment Claims: Week Of 2/7/15
For the benefit week ending on February 7, 2015, North Carolinians filed some 4,635 initial claims for state unemployment insurance benefits and 41,320 claims for state-funded continuing benefits. Compared to the prior week, there were fewer initial claims and fewer continuing claims. These figures come from data released by the US Department of Labor.
Averaging new and continuing claims over a four-week period — a process that helps adjust for seasonal fluctuations and better illustrates trends — shows that an average of 5,156 initial claims were filed over the previous four weeks, along with an average of 42,705 continuing claims. Compared to the previous four-week period, the average number of initial claims was lower, and the average number of continuing claims was lower.
One year ago, the four-week average for initial claims stood at 5,803, and the four-week average of continuing claims equaled 73,116.
In recent months covered employment has increased and now exceeds the level recorded a year ago (3.94 million versus 3.89 million). Nevertheless, there are still fewer covered workers than there were in January 2008, which means that payrolls are smaller today than they were roughly seven years ago.
The graph (below right) shows the changes in unemployment insurance claims measured as a share of covered employment in North Carolina since the recession’s start in December 2007.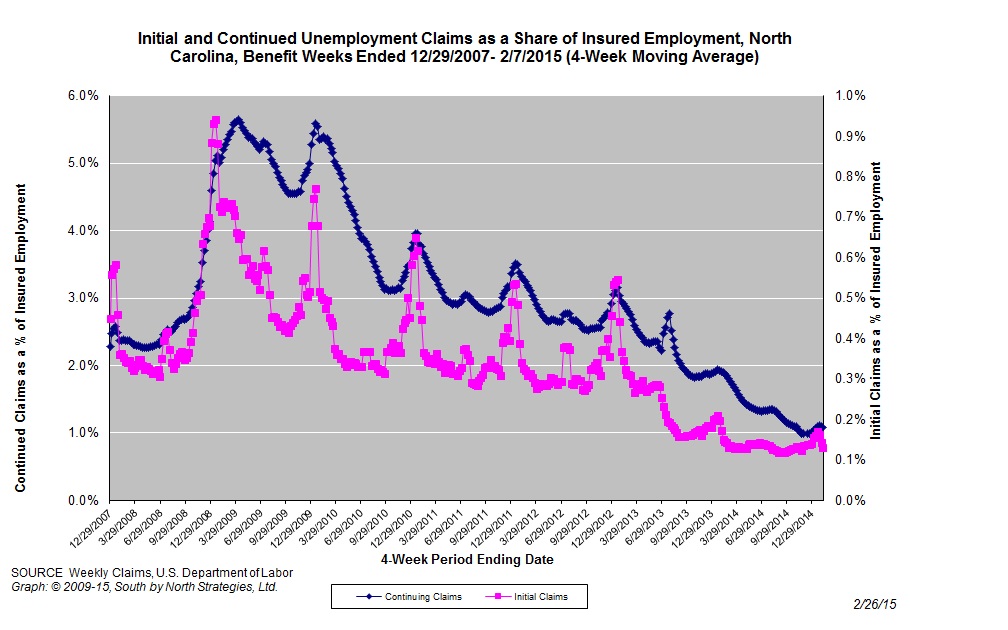
Both new and continuing claims have peaked for this cycle, and the four-week averages of new and continuing claims have fallen considerably. The four-week average of initial claims, when measured as a share of covered employment, is just above the lowest level recorded since early 2008, while the four-week average of continuing claims also is somewhat above the lowest level recorded since early 2008.
Note that the recent year-over-year declines in new and continuing claims are not necessarily indicative of an improving labor market. State legislation that took effect on July 1, 2013, made major changes to insurance eligibility criteria, and the more stringent criteria eliminate claims that would have been valid prior to July 1, 2013. Additionally, the legislation reduced the maximum number of weeks of state-funded insurance for which a claimant is eligible — an action that reduces the number of continuing claims.
To place the numbers in context, consider how the four-week average of initial claims (5,156) was 11.1 percent lower than the figure recorded one year ago (5,803), while the average number of continuing claims was 41.6 percent lower (42,705 versus 73,116). Given the modest rate of job growth that has occurred in North Carolina over the past year, such declines likely are, at least in part, products of changes to unemployment insurance laws rather than improvements in underlying economic conditions.
NC Unemployment Claims: Week Of 1/31/15
For the benefit week ending on January 31, 2015, North Carolinians filed some 5,498 initial claims for state unemployment insurance benefits and 42,656 claims for state-funded continuing benefits. Compared to the prior week, there were more initial claims and fewer continuing claims. These figures come from data released by the US Department of Labor.
Averaging new and continuing claims over a four-week period — a process that helps adjust for seasonal fluctuations and better illustrates trends — shows that an average of 5,681 initial claims were filed over the previous four weeks, along with an average of 43,237 continuing claims. Compared to the previous four-week period, the average number of initial claims was lower, and the average number of continuing claims was lower.
One year ago, the four-week average for initial claims stood at 6,729, and the four-week average of continuing claims equaled 74,148.
In recent months covered employment has increased and now exceeds the level recorded a year ago (3.94 million versus 3.89 million). Nevertheless, there are still fewer covered workers than there were in January 2008, which means that payrolls are smaller today than they were roughly seven years ago.
The graph (below right) shows the changes in unemployment insurance claims measured as a share of covered employment in North Carolina since the recession’s start in December 2007.
Both new and continuing claims have peaked for this cycle, and the four-week averages of new and continuing claims have fallen considerably. The four-week average of initial claims, when measured as a share of covered employment, is somewhat above the lowest level recorded since early 2008, while the four-week average of continuing claims also is above the lowest level recorded since early 2008.
Note that the recent year-over-year declines in new and continuing claims are not necessarily indicative of an improving labor market. State legislation that took effect on July 1, 2013, made major changes to insurance eligibility criteria, and the more stringent criteria eliminate claims that would have been valid prior to July 1, 2013. Additionally, the legislation reduced the maximum number of weeks of state-funded insurance for which a claimant is eligible — an action that reduces the number of continuing claims.
To place the numbers in context, consider how the four-week average of initial claims (5,498) was 18.3 percent lower than the figure recorded one year ago (6,729), while the average number of continuing claims was 42.5 percent lower (42,656 versus 74,148). Given the modest rate of job growth that has occurred in North Carolina over the past year, such declines likely are, at least in part, products of changes to unemployment insurance laws rather than improvements in underlying economic conditions.
Online Training: An Introduction to Labor Market Information
In Winter 2015, South by North Strategies developed and delivered two online training sessions on the labor market information (LMI) system. Prepared for the NC Workforce Development Training Center, these webinars offered workforce development professionals an introduction to core LMI concepts and a high-level overview of essential sources of LMI data.
NC Unemployment Claims: Week Of 1/24/15
For the benefit week ending on January 24, 2015, North Carolinians filed some 5,427 initial claims for state unemployment insurance benefits and 43,424 claims for state-funded continuing benefits. Compared to the prior week, there were more initial claims and more continuing claims. These figures come from data released by the US Department of Labor.
Averaging new and continuing claims over a four-week period — a process that helps adjust for seasonal fluctuations and better illustrates trends — shows that an average of 6,409 initial claims were filed over the previous four weeks, along with an average of 43,653 continuing claims. Compared to the previous four-week period, the average number of initial claims was lower, and the average number of continuing claims was higher.
One year ago, the four-week average for initial claims stood at 7,633, and the four-week average of continuing claims equaled 74,573.
In recent months covered employment has increased and now exceeds the level recorded a year ago (3.94 million versus 3.87 million). Nevertheless, there are still fewer covered workers than there were in January 2008, which means that payrolls are smaller today than they were seven years ago.
The graph (below right) shows the changes in unemployment insurance claims measured as a share of covered employment in North Carolina since the recession’s start in December 2007.
Both new and continuing claims have peaked for this cycle, and the four-week averages of new and continuing claims have fallen considerably. The four-week average of initial claims, when measured as a share of covered employment, is somewhat above the lowest level recorded since early 2008, while the four-week average of continuing claims also is above the lowest level recorded since early 2008.
Note that the recent year-over-year declines in new and continuing claims are not necessarily indicative of an improving labor market. State legislation that took effect on July 1, 2013, made major changes to insurance eligibility criteria, and the more stringent criteria eliminate claims that would have been valid prior to July 1, 2013. Additionally, the legislation reduced the maximum number of weeks of state-funded insurance for which a claimant is eligible — an action that reduces the number of continuing claims.
To place the numbers in context, consider how the four-week average of initial claims (6,409) was 16 percent lower than the figure recorded one year ago (7,633), while the average number of continuing claims was 41.5 percent lower (43,653 versus 74,573). Given the modest rate of job growth that has occurred in North Carolina over the past year, such declines likely are, at least in part, products of changes to unemployment insurance laws rather than improvements in underlying economic conditions.
 Email Sign-Up