

US Labor Market Improved In January
CHAPEL HILL, NC (February 6, 2015) – In January, the national labor market added 257,000 more jobs than it lost due entirely to gains in the private sector. After accounting for annual statistical updates, the unemployment rate (5.7 percent) and the number of unemployed persons (9 million) basically were unchanged in January from the prior month.
“January was the 52nd-straight month in which the United States experienced net job growth,” said John Quinterno, a principal with South by North Strategies, Ltd., a research firm specializing in economic and social policy. “Over the year, the economy netted an average of 267,000 jobs per month, a pace that has mitigated but has not undone the damage inflicted to the labor market by the last recession.”
In January, the nation’s employers added 257,000 more payroll jobs than they cut. All of the gain originated in the private sector (+267,000), while public employers cut 10,000 more positions than they added. Within the private sector, payroll levels increased the most in the trade, transportation, and utilities sector (+51,000, with 90 percent of the gain occurring in the retail trade subsector), followed by the education and health services (+46,000) and the construction and professional business services sectors (both +39,000). Payroll levels in all other major industry groups rose in January or essentially held steady.
Additionally, the payroll employment numbers for November and December underwent revisions; with the updates, the economy netted 752,000 jobs over those two months, not the 605,000 positions previously reported. With those changes, the average pace of monthly job growth in the United States recorded over the past year rose to 267,000.
“The United States has experienced steady job growth for over four years, but the pace of growth has been modest relative to the country’s needs,” noted Quinterno. “While the United States has more payroll jobs than it did in December 2007, the current average monthly rate of job growth is insufficient to close the jobs gap caused by the recession anytime soon.
After accounting for annual statistical updates, labor market conditions as measured by the household survey improved in January. In January, the number of Americans who were employed increased by 435,000 persons. At the same time, the overall size of the labor force rose by 703,000 persons. Meanwhile, the share of working-age Americans participating in the labor force rose in January (62.9 percent), while the share of working-age Americans with a job was unchanged (59.3 percent).
In January, 9 million Americans were unemployed (5.7 percent). Another 6.8 million individuals worked part time despite preferring full-time positions. An additional 682,000 individuals (not seasonally adjusted) were so discouraged about their job prospects that they had stopped searching for work altogether; those persons were part of a larger population of 2.2 million Americans who were marginally attached to the labor force.
Last month, the unemployment rate was higher for adult male workers than adult female workers (5.3 percent versus 5.1 percent). Unemployment rates were higher among Black (10.3 percent) and Hispanic workers (6.7 percent) than among white ones (4.9 percent). The unemployment rate among teenagers was 18.8 percent.
Additionally, 5.3 percent of all veterans were unemployed, and the rate among recent veterans (served after September 2001) was 7.9 percent. At the same time, 11.9 percent of Americans with disabilities were jobless and seeking work. (Both not seasonally adjusted.)
Jobs remained comparatively hard to find in January. Last month, the underemployment rate equaled 11.3 percent. Among unemployed workers, 31.5 percent had been jobless for at least six months, and the average spell of unemployment equaled 32.3 weeks.
In January, the leading cause of unemployment remained a job loss or the completion of a temporary job, which was the reason cited by 47.4 percent of unemployed persons. Another 31.6 percent of unemployed persons were re-entrants to the labor market, while 11.5 percent were new entrants. Voluntary job leavers accounted for the remaining 9.5 percent of the total.
“The January employment report contained a number of positive developments, although annual technical updates to the various data series complicate the process of drawing meaningful conclusions,” observed Quinterno. “Labor market conditions nevertheless remain sub-optimal, with the problems of underemployment and long-term unemployment remaining particularly pronounced. Weak conditions, in turn, are preventing American workers from experiencing robust improvements in their wages and living standards.”
NC Unemployment Claims: Week Of 1/17/15
For the benefit week ending on January 17, 2015, North Carolinians filed some 5,065 initial claims for state unemployment insurance benefits and 43,419 claims for state-funded continuing benefits. Compared to the prior week, there were fewer initial claims and fewer continuing claims. These figures come from data released by the US Department of Labor.
Averaging new and continuing claims over a four-week period — a process that helps adjust for seasonal fluctuations and better illustrates trends — shows that an average of 6,723 initial claims were filed over the previous four weeks, along with an average of 43,228 continuing claims. Compared to the previous four-week period, the average number of initial claims was higher, and the average number of continuing claims was higher.
One year ago, the four-week average for initial claims stood at 8,126, and the four-week average of continuing claims equaled 75,262.
In recent months covered employment has increased and now exceeds the level recorded a year ago (3.94 million versus 3.86 million). Nevertheless, there are still fewer covered workers than there were in January 2008, which means that payrolls are smaller today than they were seven years ago.
The graph (below right) shows the changes in unemployment insurance claims measured as a share of covered employment in North Carolina since the recession’s start in December 2007.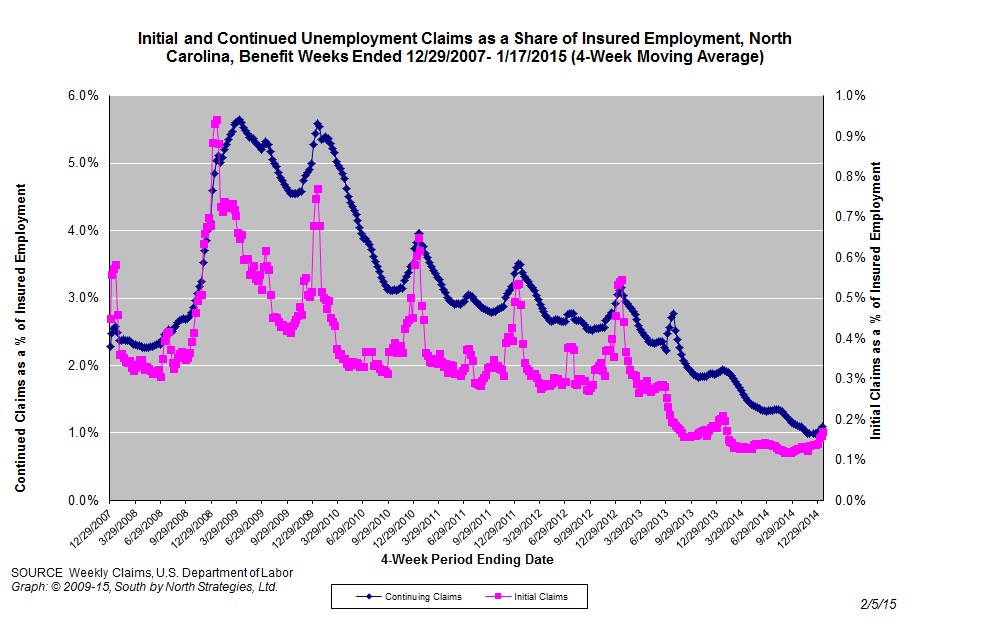
Both new and continuing claims have peaked for this cycle, and the four-week averages of new and continuing claims have fallen considerably. The four-week average of initial claims, when measured as a share of covered employment, is near the lowest level recorded since early 2008, while the four-week average of continuing claims also is near the lowest level recorded since early 2008.
Note that the recent year-over-year declines in new and continuing claims are not necessarily indicative of an improving labor market. State legislation that took effect on July 1, 2013, made major changes to insurance eligibility criteria, and the more stringent criteria eliminate claims that would have been valid prior to July 1, 2013. Additionally, the legislation reduced the maximum number of weeks of state-funded insurance for which a claimant is eligible — an action that reduces the number of continuing claims.
To place the numbers in context, consider how the four-week average of initial claims (6,723) was 17.3 percent lower than the figure recorded one year ago (8,126), while the average number of continuing claims was 41 percent lower (43,228 versus 73,262). Given the modest rate of job growth that has occurred in North Carolina over the past year, such large declines likely are products of changes to unemployment insurance laws rather than improvements in underlying economic conditions.
Local Unemployment Rates Fell In 2014
CHAPEL HILL, NC (February 4, 2015) – Over the course of 2014, unemployment rates fell in 99 of North Carolina’s 100 counties and in all 14 of the state’s metropolitan areas. Yet at the same time, the size of the local labor force shrank in 90 counties and in 12 metro areas.
These findings come from new estimates released today by the Labor and Economic Analysis Division of the North Carolina Department of Commerce.
“Local unemployment rates declined across all of North Carolina over the course of 2014,” said John Quinterno, a principal with South by North Strategies, Ltd., a research firm specializing in economic and social policy. “While noteworthy, the declines in local unemployment rates do not alter the fact that many local labor markets continue to underperform when measured in relation to a broader set of important indicators.”
Compared to December 2007, which is when the national economy fell into recession, North Carolina now has 1.2 percent more payroll jobs (+50,700). In December 2014, the state gained 15,100 more jobs than it lost (+0.4 percent). Since bottoming out in February 2010, the state’s labor market has netted some 6,500 payroll jobs per month, resulting in a cumulative gain of 379,500 payroll jobs (+9.9 percent).
Between November and December of 2014, local unemployment rates decreased in 56 of the state’s 100 counties, increased in 28 counties, and held constant in 16 counties. Individual county rates in December ranged from 3.8 percent in Chatham County to 12.3 percent in Graham County. Overall, 2 counties posted unemployment rates greater than or equal to 10 percent, and 39 counties posted rates between 6 and 9.9 percent.
“Non-metropolitan labor markets continue to lag behind metropolitan ones,” noted Quinterno. “In December, 6 percent of the non-metro labor force was unemployed, compared to 5 percent of the metro labor force. Compared to December 2007, the non-metro labor force now has 7.3 percent fewer employed persons, while the number of unemployed individuals is 1 percent smaller. Over that time, the size of the non-metro labor force has fallen by 6.9 percent. In fact, North Carolina’s total labor force in December would have been 2 percent larger if the size of the non-metropolitan labor force had held steady at its pre-recession level, all else being equal.”
Between November and December, unemployment rates fell in 11 of the state’s 14 metro areas and held steady in three metro areas. Rocky Mount had the highest unemployment rate (7.7 percent), followed by Fayetteville (6.1 percent) and Goldsboro (5.7 percent). Asheville had the lowest unemployment rate (4 percent), followed by Raleigh-Cary (4.2 percent), Durham-Chapel Hill (4.3 percent), and Winston-Salem (4.8 percent).
Compared to December 2013, unemployment rates in December 2014 were lower in 99 counties and in all 14 metro areas. Over the year, however, labor force sizes decreased in 90 counties and in 12 metros. And the statewide labor force (seasonally adjusted) was 0.9 percent smaller (-42,245 individuals) in December 2014 than it was in December 2013.
Among metros, Rocky Mount’s labor force contracted at the fastest rate (-4.2 percent) over the course of the year, followed by Hickory-Morganton-Lenoir (-2.8 percent) and Fayetteville (-2.7 percent). With those changes, metro areas now are home to 72.6 percent of the state’s labor force, with 51.5 percent of the labor force residing in the Triangle, Triad, and Charlotte metros.
In the long term, improvements in overall labor market conditions depend on growth in the Charlotte, Research Triangle, and Piedmont Triad regions. Collectively, employment in the three metro regions has risen by 5.8 percent since December 2007, and the combined unemployment rate in December totaled 4.7 percent, as compared to 4.5 percent in December 2007. Of the three broad regions, the Research Triangle had the lowest unemployment rate (4.3 percent), followed by the Piedmont Triad (5.1 percent) and Charlotte (5.3 percent).
The local employment report for December also provided insights into the effects of the extensive changes to the state’s system of unemployment insurance implemented in 2013. Last month, the number of regular unemployment insurance initial claims filed in North Carolina totaled 26,767, down from the 33,157 initial claims filed a year earlier (-19.3 percent).
Mecklenburg County was home to greatest number of regular initial claims (2,569), followed by Wake (1,688), Guilford (1,466), Cumberland (917), and Forsyth (840) counties.
In December 2014, North Carolinians received a (nominal) total of $28.5 million in regular state-funded and federal unemployment insurance compensation, down from the (nominal) $62.2 million received in December 2013. This decline (-54.2 percent) is attributable to a mix of factors, such as drops in the number of insurance claims resulting from economic improvements and legal changes that restricted eligibility for unemployment insurance compensation.
“Many labor markets across North Carolina, particularly some of the largest metropolitan ones, have experienced improvements over the past year,” said Quinterno. “While those improvements are important, they must not obscure the fact that many local labor markets—non-metropolitan ones especially—continue to underperform and have not yet recovered from the last recession.”
NC Unemployment Claims: Week Of 1/10/15
For the benefit week ending on January 10, 2015, North Carolinians filed some 6,732 initial claims for state unemployment insurance benefits and 43,448 claims for state-funded continuing benefits. Compared to the prior week, there were fewer initial claims and fewer continuing claims. These figures come from data released by the US Department of Labor.
Averaging new and continuing claims over a four-week period — a process that helps adjust for seasonal fluctuations and better illustrates trends — shows that an average of 6,321 initial claims were filed over the previous four weeks, along with an average of 41,721 continuing claims. Compared to the previous four-week period, the average number of initial claims was higher, and the average number of continuing claims was higher.
One year ago, the four-week average for initial claims stood at 7,843, and the four-week average of continuing claims equaled 73,589.
In recent months covered employment has increased and now exceeds the level recorded a year ago (3.93 million versus 3.89 million). Nevertheless, there are still fewer covered workers than there were in January 2008, which means that payrolls are smaller today than they were seven years ago.
The graph (below right) shows the changes in unemployment insurance claims measured as a share of covered employment in North Carolina since the recession’s start in December 2007.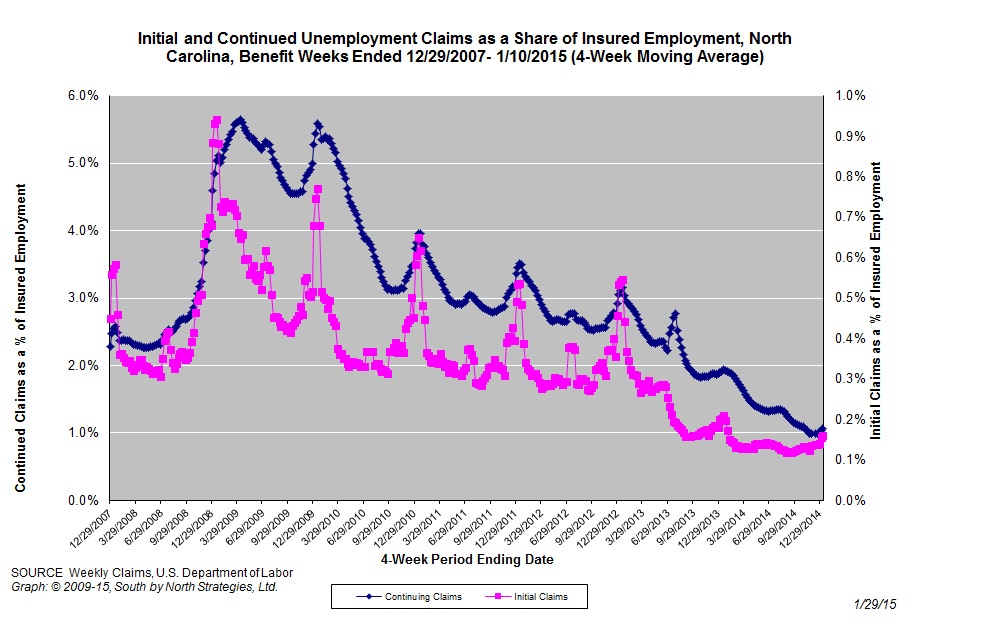
Both new and continuing claims have peaked for this cycle, and the four-week averages of new and continuing claims have fallen considerably. The four-week average of initial claims, when measured as a share of covered employment, is near the lowest level recorded since early 2008, while the four-week average of continuing claims also is near the lowest level recorded since early 2008.
Note that the recent year-over-year declines in new and continuing claims are not necessarily indicative of an improving labor market. State legislation that took effect on July 1, 2013, made major changes to insurance eligibility criteria, and the more stringent criteria eliminate claims that would have been valid prior to July 1, 2013. Additionally, the legislation reduced the maximum number of weeks of state-funded insurance for which a claimant is eligible — an action that reduces the number of continuing claims.
To place the numbers in context, consider how the four-week average of initial claims (6,732) was 14.2 percent lower than the figure recorded one year ago (7,843), while the average number of continuing claims was 41 percent lower (43,448 versus 73,589). Given the modest rate of job growth that has occurred in North Carolina over the past year, such large declines likely are products of changes to unemployment insurance laws rather than improvements in underlying economic conditions.
North Carolina Payrolls Expand in 2014
CHAPEL HILL, NC (January 27, 2015) – In December, employers in North Carolina added 15,100 more payroll jobs than they cut (+0.4 percent), due entirely to hiring in the private sector. With that gain, the state ended 2014 with 114,500 more payroll jobs than it had at the beginning of the year (+2.8 percent). Yet compared to December 2007, North Carolina ended 2014 with just 50,700 more payroll jobs (+1.2 percent) than it had seven years ago.
These findings come from new data released today by the Labor and Economic Analysis Division of the NC Department of Commerce.
“Judged by recent standards, 2014 proved to be a relatively decent year for job growth in North Carolina,” said John Quinterno, a principal with South by North Strategies, Ltd., a research firm specializing in economic and social policy. “The state’s 2.8 percent rate of job growth somewhat exceeded the national growth rate of 2.1 percent and was better than the state-level rates recorded in any year since the onset of North Carolina’s recovery in 2010.”
During 2014, North Carolina employers added 114,500 more jobs than they cut (+2.8 percent). Private-sector payrolls netted 119,900 positions (+3.5 percent), while public-sector payrolls shed, on net, 5,400 jobs (-0.8 percent), owing entirely to net reductions by state government (-7,900, -3.8 percent). Within private industry, the professional and business services sector netted the most jobs (+40,200, +7.1 percent), with 50.2 percent of that gain originating in the administrative and waste management subsector. The trade, transportation, and utilities sector netted 17,600 payroll jobs (+2.3 percent, with 57.4 percent of the gain originating in the retail trade subsector), followed by the construction (+12,500, +7.2 percent) and leisure and hospitality services (+11,800, +2.7 percent) sectors.
Overall, no major private industrial sector experienced a net decline in payroll size in 2014.
A revision to the November 2014 payroll data found that the state gained 700 more jobs that month than first estimated (+17,100 versus +16,400). With the revision, North Carolina now has, on net, slightly more payroll jobs (+50,700, +1.2 percent) than it did in December 2007, which is when the “Great Recession” began nationally. Since bottoming out in February 2010, the state has netted an average of 6,543 payroll jobs per month, resulting in a cumulative gain of 379,500 positions (+9.9 percent).
“The fact that North Carolina now has slightly more payroll jobs than it did seven years ago does not mean that the state’s labor market has recovered,” cautioned Quinterno. “Over the past seven years, North Carolina has needed not only to replace the jobs lost during the recession, but also to add jobs to keep pace with the growth of the working-age population. Depending on the assumptions used, North Carolina is anywhere from 200,000 to 400,000 payroll jobs short of the number it should have added since late 2007 to accommodate population growth.”
During 2014, the statewide unemployment rate as measured in the monthly household survey dropped sharply, falling to 5.5 percent from 6.9 percent. Additionally, the December unemployment rate was the lowest one logged in any month since mid-2008. Over the course of 2014, the number of employed North Carolinians rose (+25,339, + 0.6 percent), while the number of unemployed persons fell sharply (-67,584, -20.9 percent). Much of the decline in the unemployment rate therefore was attributable mathematically to a contraction in the size of the labor force (-42,245, -0.9 percent). In fact, the size of North Carolina’s labor force in December was smaller than it has been in any month since January 2010.
Over the course of 2014, some 62.5 percent of the decline in the number of unemployed North Carolinians was attributable to people who left the labor force entirely rather than to those who became employed. If those 42,245 leavers from the labor force were added back and considered unemployed, the statewide unemployment rate in December would have equaled 6.4 percent. Even if 50 percent of those individuals were added back to the labor force and considered unemployed, the statewide unemployment rate would have equaled 6 percent.
Year-over-year declines in the statewide labor force participation rate provide additional evidence of a labor market with problematic underlying dynamics. In December, the share of working-age North Carolinians participating in the labor market was 59.8 percent, which was lower than the 61.1 percent figure logged a year ago, not to mention the lowest monthly rate recorded at any time since January 1976.
In addition, another important measure of labor utilization, the employment-to-population ratio, fell over the year, dropping to 56.5 percent from 56.8 percent. The current share of working-age North Carolinians with a job now is just slightly above the lowest rate logged at any point since 1976 (56.3 percent).
The December labor market report provides additional insight into the effects of the extensive changes to the state’s system of unemployment insurance implemented in July 2013. Over the year, the number of claimants of regular state-funded insurance fell by 47.8 percent, dropping to 31,806 from 60,889. Also in December, the state paid a (nominal) total of $27.6 million in regular state-funded unemployment insurance compensation, an amount 53.3 percent lower than the (nominal) total of $59.1 million paid in December 2013.
“North Carolina netted jobs in 2014 at a rate faster than those posted in recent years, but even with those gains, the state’s labor market is still not recovered,” added Quinterno. “Compared to seven years ago, North Carolina has just 1.2 percent more payroll jobs, and it has 11.7 percent more unemployed residents and an unemployment rate that is 0.5 percentage points higher. And a smaller share of the working-age population is participating in the labor force than at any point in almost 40 years.”
 Email Sign-Up