

NC Unemployment Claims: Week Of 9/20/14
For the benefit week ending on September 20, 2014, North Carolinians filed some 4,614 initial claims for state unemployment insurance benefits and 44,533 claims for state-funded continuing benefits. Compared to the prior week, there were fewer initial claims and fewer continuing claims. These figures come from data released by the US Department of Labor.
Averaging new and continuing claims over a four-week period — a process that helps adjust for seasonal fluctuations and better illustrates trends — shows that an average of 4,658 initial claims were filed over the previous four weeks, along with an average of 46,156 continuing claims. Compared to the previous four-week period, the average number of initial claims was lower, and the average number of continuing claims was lower.
One year ago, the four-week average for initial claims stood at 6,014, and the four-week average of continuing claims equaled 74,358.
In recent months covered employment has increased and now exceeds the level recorded a year ago (3.9 million versus 3.8 million). Nevertheless, there are still fewer covered workers than there were in January 2008, which means that payrolls are smaller today than they were more than 6.5 years ago.
The graph (below right) shows the changes in unemployment insurance claims measured as a share of covered employment in North Carolina since the recession’s start in December 2007.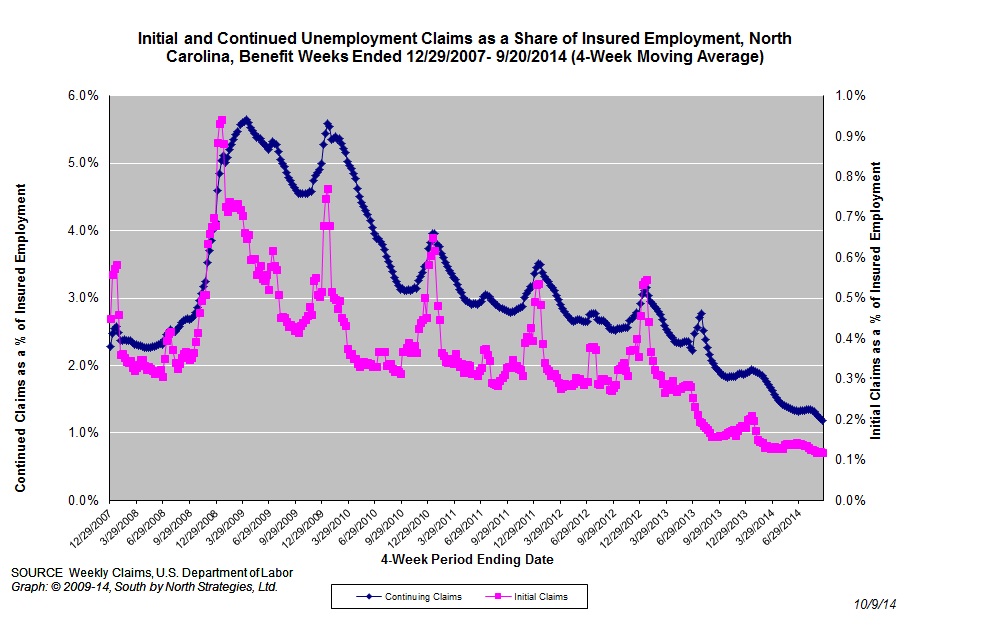
Both new and continuing claims have peaked for this cycle, and the four-week averages of new and continuing claims have fallen considerably. The four-week average of initial claims, when measured as a share of covered employment, is at the lowest level recorded since early 2008, while the four-week average of continuing claims is at the lowest level recorded since early 2008.
Note that the recent year-over-year declines in new and continuing claims are not necessarily indicative of an improving labor market. State legislation that took effect on July 1, 2013, made major changes to insurance eligibility criteria, and the more stringent criteria eliminate claims that would have been valid prior to July 1, 2013. Additionally, the legislation reduced the maximum number of weeks of state-funded insurance for which a claimant is eligible — an action that reduces the number of continuing claims.
To place the numbers in context, consider how the four-week average of initial claims (4,658) was 22.5 percent lower than the figure recorded one year ago (6,014), while the average number of continuing claims was 37.9 percent lower (46,156 versus 74,358). Given the modest rate of job growth that has occurred in North Carolina over the past year, such declines likely are products of changes to unemployment insurance laws rather than improvements in underlying economic conditions.
Local Unemployment Rates Down over The Year
CHAPEL HILL, NC (October 1, 2014) – Between August 2013 and August 2014, unemployment rates fell in 96 of North Carolina’s 100 counties and in all 14 of the state’s metropolitan areas. Yet over the same period, the size of the local labor force shrank in 84 counties and in 10 metro areas.
These findings come from new estimates released today by the Labor and Economic Analysis Division of the North Carolina Department of Commerce.
“Local unemployment rates decreased across most of North Carolina over the past year,” said John Quinterno, a principal with South by North Strategies, Ltd., a research firm specializing in economic and social policy. “At the same time, the declines do not alter the fact that unemployment remains a serious problem. In fact, 56 counties and 11 metro areas had unemployment rates in August 2014 that exceeded those posted in August 2008.”
Compared to December 2007, which is when the national economy fell into recession, North Carolina now has 0.3 percent fewer payroll jobs (-14,300). In August, the state gained 12,500 more jobs than it lost (+0.3 percent). Since bottoming out in February 2010, the state’s labor market has netted some 5,820 jobs per month, resulting in a cumulative gain of 314,500 positions (+8.2 percent). At that rate, all else equal, it would take until late 2014 for the state to have as many payroll jobs as it did at the end of 2007.
Between July and August 2014, local unemployment rates increased in 74 of the state’s 100 counties, decreased in 12 counties, and held constant in 14 counties. Individual county rates in August ranged from 4 percent in Currituck County to 13.4 percent in Graham County. Overall, 9 counties posted unemployment rates greater than or equal to 10 percent, and 54 counties posted rates between 7 and 9.9 percent. (Because seasonal fluctuations in labor markets are pronounced in the summer, month-to-month changes provide limited insight into trends.)
“Non-metropolitan labor markets still lag behind metropolitan ones,” noted Quinterno. “In August, 7.7 percent of the non-metro labor force was unemployed, compared to 6.7 percent of the metro labor force. Compared to December 2007, the non-metro labor force now has 4.1 percent fewer employed persons, while the number of unemployed individuals is 32 percent larger. Over that time, the size of the non-metro labor force has increased by 6.4 percent. In fact, North Carolina’s total labor force in August would have been 1.2 percent larger if the size of the nonmetropolitan labor force had held steady, all else being equal”
Between July and August, unemployment rates rose in 9 of the state’s 14 metro areas. Rocky Mount had the highest unemployment rate (10.2 percent), followed by Fayetteville (8.2 percent) and Hickory-Morganton-Lenoir (7.5 percent). Asheville had the lowest unemployment rate (5.3 percent), followed by Durham-Chapel Hill and Raleigh-Cary (both 5.7 percent).
Compared to August 2013, unemployment rates in August 2014 were lower in 96 counties and all 14 metro areas. Over the year, however, labor force sizes decreased in 84 counties and in 10 metros. And the statewide labor force (seasonally adjusted) was 0.4 percent smaller (-18,567 individuals) in August 2014 than it was in August 2013.
Among metros, Rocky Mount’s labor force contracted at the fastest rate (-3.6 percent) over the course of the year, followed by Hickory-Morganton-Lenoir (-2 percent) and Fayetteville (-1.9 percent). With those changes, metro areas now are home to 72.4 percent of the state’s labor force, with 51.2 percent of the labor force residing in the Triangle, Triad, and Charlotte metros.
In the long term, improvements in overall labor market conditions depend on growth in the Charlotte, Research Triangle, and Piedmont Triad regions. Yet growth in these metros, though improved in recent months, remains subdued. Collectively, employment in the three metro regions has risen by 5.3 percent since December 2007, and the combined unemployment rate in August totaled 6.5 percent, as compared to 6.3 percent in August 2008. Of the three broad regions, the Research Triangle had the lowest unemployment rate (5.8 percent), followed by Charlotte and the Piedmont Triad (both 7 percent).
The local employment report for August also provided insights into the effects of the extensive changes to the state’s system of unemployment insurance implemented last summer. Last month, the number of regular unemployment insurance initial claims filed in North Carolina totaled 20,279, down from the 28,443 initial claims filed a year earlier (-28.7 percent).
Mecklenburg County was home to greatest number of regular initial claims (2,453), followed by Wake (1,695), Guilford (1,107), Cumberland (709), and Forsyth (639) counties.
In August 2014, North Carolinians received a (nominal) total of $34.2 million in regular state-funded and federal unemployment insurance compensation, down from the (nominal) $80.1 million received in August 2013. This decline (-57.3 percent) is attributable to a mix of factors, such as drops in the number of insurance claims resulting from economic improvements and legal changes that restricted eligibility for insurance compensation.
Additionally, the state’s decision to exit the federal Emergency Unemployment Compensation (EUC) program reduced the amount of federal unemployment insurance compensation flowing into the state in August. Between August 2013 and August 2014, the amount of federal unemployment insurance benefits paid to North Carolinians fell by 75.6 percent, dropping to a (nominal) total of $1.1 million from a (nominal) total of $4.5 million. (Note that the US Congress allowed the EUC program to expire at the start of 2014.)
“Even with recent improvements in certain important indicators, many local labor markets in North Carolina continue to underperform and have yet to recover from the last recession,” said Quinterno. “The August data were consistent with the basic pattern of slow growth that has defined the state’s economy for the past 4.5 years.”
NC’S Labor Market Wilts In August
CHAPEL HILL, NC (September 19, 2014) – In August, employers in North Carolina added 12,500 more payroll jobs than they cut (+0.3 percent), due largely to hiring by local governments. The monthly household survey, meanwhile, recorded a rise in the unemployment rate to 6.8 percent, even though the size of the labor force fell over the month. With those changes, North Carolina has 0.3 percent fewer jobs, 37.7 percent more unemployed persons, and a much higher unemployment rate (+1.8 percentage points) than it did over 6.5 years ago.
These findings come from new data released today by the Labor and Economic Analysis Division of the NC Department of Commerce.
“The August employment report offered little evidence of a labor market that has turned a corner,” said John Quinterno, a principal with South by North Strategies, Ltd., a research firm specializing in economic and social policy. “Last month, North Carolina netted some jobs, but at the same time, the state experienced declines in the size of the labor force and the number of employed residents. Although conditions in the state are better in some ways than they were a year ago, they still have not returned to healthy levels.”
Between July 2014 and August 2014, North Carolina employers added 12,500 more jobs than they cut (+0.3 percent). Private-sector payrolls netted just 4,000 positions (+0.1 percent), and public-sector payrolls gained, on net, 8,500 jobs (+1.2 percent), owing primarily to net hiring by local governments (+6,700, +1.6 percent). Within private industry, the education and health services sector netted the most jobs (+2,700, +0.5 percent), followed by the professional and business services sector (+2,500, +0.4 percent) and the manufacturing sector (+1,900, +0.4 percent). Meanwhile, the leisure and hospitality services sector shed the most jobs (-3,300 jobs, -0.7 percent), followed by the construction sector (-1,300, -0.7 percent). All other major industrial sectors experienced few changes in payroll sizes.
A revision to the July 2014 payroll data found that the state gained 1,400 more jobs that month than first estimated (+17,200 versus +15,800). With the revision, North Carolina has, on net, 14,300 fewer payroll positions (-0.3 percent) than it did in December 2007. Since bottoming out in February 2010, the state has netted an average of 5,800 payroll jobs per month, resulting in a cumulative gain of 314,500 positions (+8.2 percent). At that rate, holding all else equal, it would take until later this year for the state to have as many jobs as it did at the end of 2007.
“While positive, the pace of payroll growth in North Carolina has not accelerated radically in recent years,” noted Quinterno. “Between August 2013 and August 2014, the total number of payroll jobs in North Carolina grew by 2.4 percent. Between August 2012 and August 2013, the total of number payroll jobs in North Carolina rose by 1.7 percent, while between August 2011 and August 2012, the rate of growth was 1.6 percent. In effect, North Carolina has been mired in a pattern of slow job growth for the past several years.”
The household data recorded in August contained negative news about the state’s labor market. Last month, the statewide unemployment rate rose to 6.8 percent, which was the highest rate logged so far this year. Furthermore, the underlying dynamics of the labor market were unimpressive. Last month, the number of employed persons in the state fell by 28,666 (-0.7 percent), while the number of unemployed persons increased by 10,404 (+3.4 percent). And last month, the size of the North Carolina labor force decreased by 18,262 persons (-0.4 percent).
While the changes in household data recorded between July and August were negative, the changes over the past year were more mixed. Between August 2013 and August 2014, the number of unemployed North Carolinians fell by 57,505 persons (-15.4 percent), but 49.7 percent of the decline was attributable to people who left the labor force entirely. If those 28,567 persons were added back to the labor force and considered unemployed, the statewide unemployment rate in August would have equaled 7.3 percent. Even if 50 percent of those individuals were added back to the labor force and considered unemployed, the statewide unemployment rate would have equaled 7.1 percent.
Year-over-year declines in the statewide labor force participation rate provide additional evidence of an underperforming labor market. In August, the share of working-age North Carolinians participating in the labor market was 60.5 percent, which was lower than the 61.6 percent figure logged a year ago, as well as the lowest monthly rate recorded at any time since January 1976.
In addition, another important measure of labor utilization, the employment-to-population ratio, fell over the year, dropping to 56.4 percent from 56.7 percent. The current share of working-age North Carolinians with a job now is just 0.1 percentage points above the 38-year low of 56.3 percent posted in 2011.
The August labor market report provides additional insight into the effects of the extensive changes to the state’s system of unemployment insurance implemented last summer. Between July and August, the number of claimants of regular state-funded insurance rose by 1 percent, increasing to 39,466 from 39,066. Compared to a year earlier, however, 35,024 fewer individuals received regular state-funded insurance in August (-47 percent).
Also in August, the state paid a (nominal) total of $33.1 million in regular state-funded unemployment insurance compensation, an amount 56.2 percent lower than the (nominal) total of $75.6 million paid in August 2013.
“North Carolina netted jobs in August, but the current pace of job growth is not much greater than the rate needed to keep pace with population growth,” added Quinterno. “Observers also should be concerned that the number of unemployed North Carolinians and the statewide unemployment rate have trended upward in recent months, while the number of employed persons has trended downward. Keep in mind, too, that a steady decline in the size of the labor force is masking some of the broader problems in the labor market and actually making conditions appear somewhat better than they are.”
NC Unemployment Claims: Week Of 8/30/14
For the benefit week ending on August 30, 2014, North Carolinians filed some 4,491 initial claims for state unemployment insurance benefits and 47,504 claims for state-funded continuing benefits. Compared to the prior week, there were fewer initial claims and fewer continuing claims. These figures come from data released by the US Department of Labor.
Averaging new and continuing claims over a four-week period — a process that helps adjust for seasonal fluctuations and better illustrates trends — shows that an average of 4,663 initial claims were filed over the previous four weeks, along with an average of 49,975 continuing claims. Compared to the previous four-week period, the average number of initial claims was lower, and the average number of continuing claims was lower.
One year ago, the four-week average for initial claims stood at 6,065, and the four-week average of continuing claims equaled 79,689.
In recent months covered employment has increased and now exceeds the level recorded a year ago (3.9 million versus 3.8 million). Nevertheless, there are still fewer covered workers than there were in January 2008, which means that payrolls are smaller today than they were more than six years ago.
The graph (below right) shows the changes in unemployment insurance claims measured as a share of covered employment in North Carolina since the recession’s start in December 2007.
Both new and continuing claims have peaked for this cycle, and the four-week averages of new and continuing claims have fallen considerably. The four-week average of initial claims, when measured as a share of covered employment, is at the lowest level recorded since early 2008, while the four-week average of continuing claims is at the lowest level recorded since early 2008.
Note that the recent year-over-year declines in new and continuing claims are not necessarily indicative of an improving labor market. State legislation that took effect on July 1, 2013, made major changes to insurance eligibility criteria, and the more stringent criteria eliminate claims that would have been valid prior to July 1, 2013. Additionally, the legislation reduced the maximum number of weeks of state-funded insurance for which a claimant is eligible — an action that reduces the number of continuing claims.
To place the numbers in context, consider how the four-week average of initial claims (4,663) was 23.1 percent lower than the figure recorded one year ago (6,065), while the average number of continuing claims was 37.3 percent lower (49,975 versus 79,689). Given the modest rate of job growth that has occurred in North Carolina over the past year, such declines likely are products of changes to unemployment insurance laws rather than improvements in underlying economic conditions.
NC Unemployment Claims: Week Of 8/23/14
For the benefit week ending on August 16, 2014, North Carolinians filed some 4,873 initial claims for state unemployment insurance benefits and 49,439 claims for state-funded continuing benefits. Compared to the prior week, there were more initial claims and fewer continuing claims. These figures come from data released by the US Department of Labor.
Averaging new and continuing claims over a four-week period — a process that helps adjust for seasonal fluctuations and better illustrates trends — shows that an average of 4,823 initial claims were filed over the previous four weeks, along with an average of 51,287 continuing claims. Compared to the previous four-week period, the average number of initial claims was lower, and the average number of continuing claims was lower.
One year ago, the four-week average for initial claims stood at 6,470, and the four-week average of continuing claims equaled 83,110.
In recent months covered employment has increased and now exceeds the level recorded a year ago (3.9 million versus 3.8 million). Nevertheless, there are still fewer covered workers than there were in January 2008, which means that payrolls are smaller today than they were more than six years ago.
The graph (below right) shows the changes in unemployment insurance claims measured as a share of covered employment in North Carolina since the recession’s start in December 2007.
Both new and continuing claims have peaked for this cycle, and the four-week averages of new and continuing claims have fallen considerably. The four-week average of initial claims, when measured as a share of covered employment, is at the lowest level recorded since early 2008, while the four-week average of continuing claims is at the lowest level recorded since early 2008.
Note that the recent year-over-year declines in new and continuing claims are not necessarily indicative of an improving labor market. State legislation that took effect on July 1, 2013, made major changes to insurance eligibility criteria, and the more stringent criteria eliminate claims that would have been valid prior to July 1, 2013. Additionally, the legislation reduced the maximum number of weeks of state-funded insurance for which a claimant is eligible — an action that reduces the number of continuing claims.
To place the numbers in context, consider how the four-week average of initial claims (4,823) was 25.5 percent lower than the figure recorded one year ago (6,470), while the average number of continuing claims was 38.3 percent lower (51,287 versus 83,110). Given the modest rate of job growth that has occurred in North Carolina over the past year, such declines likely are products of changes to unemployment insurance laws rather than improvements in underlying economic conditions.
 Email Sign-Up