

North Carolina’s Rural Labor Market & “The Great Recession”
In October 2014, John Quinterno of South by North Strategies, Ltd. presented on key economic changes that have occurred to North Carolina’s rural communities as a result of “The Great Recession.” The remarks were delivered to the approximately 400 participants in the 2014 North Carolina Rural Assembly, an event held in Raleigh and organized by the North Carolina Rural Economic Development Center, a statewide nonprofit organization.
Among other topics, Quinterno discussed how the the recession spared no community in North Carolina, how the recession occurred alongside the increased “metropolitinization” of the state’s economy, how different types of non-metro communities have fared, and how the recession has exacerbated certain workforce challenges in rural communities. A copy of the presentation is available online and also is embedded below.
Other presenters discussed demographic changes in rural North Carolina, the outlook for the rural economy, and promising community development models and practices. All of those presentations also are available online.
NC Unemployment Claims: Week Of 10/18/14
For the benefit week ending on October 18, 2014, North Carolinians filed some 5,005 initial claims for state unemployment insurance benefits and 43,406 claims for state-funded continuing benefits. Compared to the prior week, there were fewer initial claims and fewer continuing claims. These figures come from data released by the US Department of Labor.
Averaging new and continuing claims over a four-week period — a process that helps adjust for seasonal fluctuations and better illustrates trends — shows that an average of 5,043 initial claims were filed over the previous four weeks, along with an average of 43,613 continuing claims. Compared to the previous four-week period, the average number of initial claims was higher, and the average number of continuing claims was lower.
One year ago, the four-week average for initial claims stood at 6,238, and the four-week average of continuing claims equaled 70,675.
In recent months covered employment has increased and now exceeds the level recorded a year ago (3.92 million versus 3.85 million). Nevertheless, there are still fewer covered workers than there were in January 2008, which means that payrolls are smaller today than they were more than 6.5 years ago.
The graph (below right) shows the changes in unemployment insurance claims measured as a share of covered employment in North Carolina since the recession’s start in December 2007.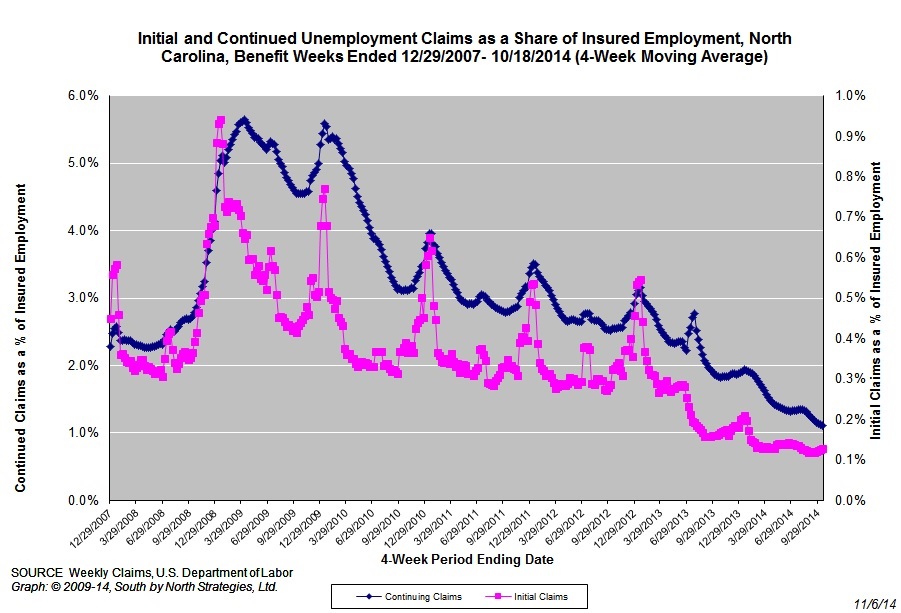
Both new and continuing claims have peaked for this cycle, and the four-week averages of new and continuing claims have fallen considerably. The four-week average of initial claims, when measured as a share of covered employment, is near the lowest level recorded since early 2008, while the four-week average of continuing claims is at the lowest level recorded since early 2008.
Note that the recent year-over-year declines in new and continuing claims are not necessarily indicative of an improving labor market. State legislation that took effect on July 1, 2013, made major changes to insurance eligibility criteria, and the more stringent criteria eliminate claims that would have been valid prior to July 1, 2013. Additionally, the legislation reduced the maximum number of weeks of state-funded insurance for which a claimant is eligible — an action that reduces the number of continuing claims.
To place the numbers in context, consider how the four-week average of initial claims (5,043) was 19.2 percent lower than the figure recorded one year ago (6,238), while the average number of continuing claims was 38.3 percent lower (43,613 versus 70,675). Given the modest rate of job growth that has occurred in North Carolina over the past year, such large declines likely are products of changes to unemployment insurance laws rather than improvements in underlying economic conditions.
NC Unemployment Claims: Week Of 10/11/14
For the benefit week ending on October 11, 2014, North Carolinians filed some 5,121 initial claims for state unemployment insurance benefits and 43,577 claims for state-funded continuing benefits. Compared to the prior week, there were fewer initial claims and fewer continuing claims. These figures come from data released by the US Department of Labor.
Averaging new and continuing claims over a four-week period — a process that helps adjust for seasonal fluctuations and better illustrates trends — shows that an average of 4,945 initial claims were filed over the previous four weeks, along with an average of 43,895 continuing claims. Compared to the previous four-week period, the average number of initial claims was higher, and the average number of continuing claims was lower.
One year ago, the four-week average for initial claims stood at 6,170, and the four-week average of continuing claims equaled 71,342.
In recent months covered employment has increased and now exceeds the level recorded a year ago (3.91 million versus 3.84 million). Nevertheless, there are still fewer covered workers than there were in January 2008, which means that payrolls are smaller today than they were more than 6.5 years ago.
The graph (below right) shows the changes in unemployment insurance claims measured as a share of covered employment in North Carolina since the recession’s start in December 2007.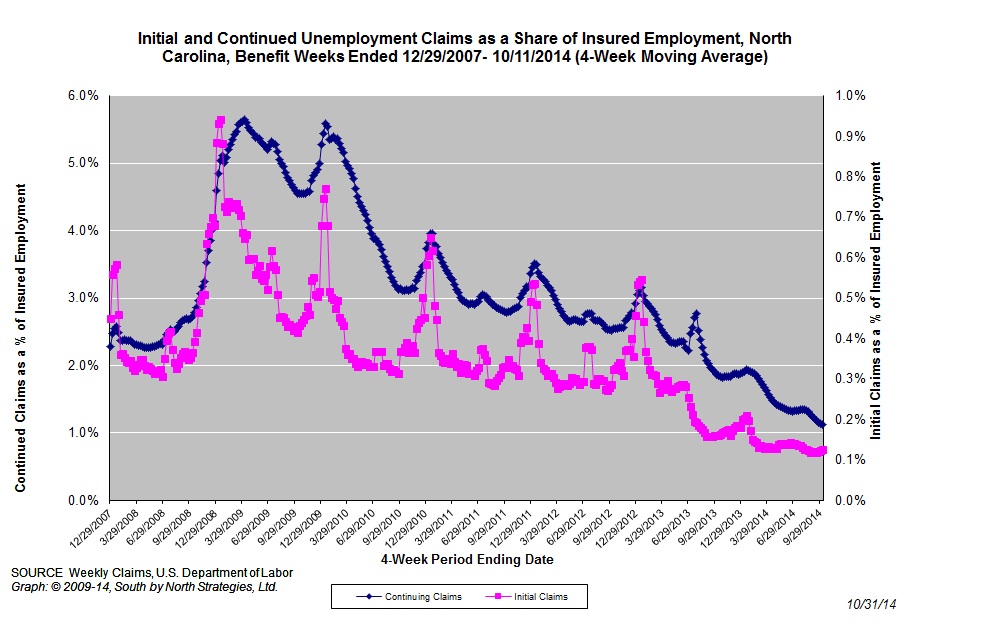
Both new and continuing claims have peaked for this cycle, and the four-week averages of new and continuing claims have fallen considerably. The four-week average of initial claims, when measured as a share of covered employment, is near the lowest level recorded since early 2008, while the four-week average of continuing claims is at the lowest level recorded since early 2008.
Note that the recent year-over-year declines in new and continuing claims are not necessarily indicative of an improving labor market. State legislation that took effect on July 1, 2013, made major changes to insurance eligibility criteria, and the more stringent criteria eliminate claims that would have been valid prior to July 1, 2013. Additionally, the legislation reduced the maximum number of weeks of state-funded insurance for which a claimant is eligible — an action that reduces the number of continuing claims.
To place the numbers in context, consider how the four-week average of initial claims (4,945) was 19.9 percent lower than the figure recorded one year ago (6,170), while the average number of continuing claims was 38.5 percent lower (43,895 versus 71,342). Given the modest rate of job growth that has occurred in North Carolina over the past year, such large declines likely are products of changes to unemployment insurance laws rather than improvements in underlying economic conditions.
Local Unemployment Rates Fall Across North Carolina
CHAPEL HILL, NC (October 29, 2014) – Between September 2013 and September 2014, unemployment rates fell in 98 of North Carolina’s 100 counties and in all 14 of the state’s metropolitan areas. Yet over the same period, the size of the local labor force shrank in 78 counties and in 9 metro areas.
These findings come from new estimates released today by the Labor and Economic Analysis Division of the North Carolina Department of Commerce.
“Local unemployment rates have fallen steadily across much of North Carolina over the past year,” said John Quinterno, a principal with South by North Strategies, Ltd., a research firm specializing in economic and social policy. “At the same time, the declines do not alter the fact that unemployment remains a serious problem. In fact, 34 counties and 4 metro areas had unemployment rates in September 2014 that exceeded those posted in September 2008.”
Compared to December 2007, which is when the national economy fell into recession, North Carolina now has 0.1 percent more payroll jobs (+2,000). In September, the state gained 14,000 more jobs than it lost (+0.3 percent). Since bottoming out in February 2010, the state’s labor market has netted some 6,015 jobs per month, resulting in a cumulative gain of 330,800 positions (+8.6 percent).
Between August and September 2014, local unemployment rates decreased in 98 of the state’s 100 counties, increased in one county, and held constant in one county. Individual county rates in September ranged from 4.2 percent in Currituck County to 12.2 percent in Graham County. Overall, 3 counties posted unemployment rates greater than or equal to 10 percent, and 60 counties posted rates between 6.1 and 9.9 percent.
“Non-metropolitan labor markets continue to lag behind metropolitan ones,” noted Quinterno. “In September, 6.8 percent of the non-metro labor force was unemployed, compared to 5.8 percent of the metro labor force. Compared to December 2007, the non-metro labor force now has 5.1 percent fewer employed persons, while the number of unemployed individuals is 15.4 percent larger. Over that time, the size of the non-metro labor force has fallen by 3.9 percent. In fact, North Carolina’s total labor force in September would have been 1.1 percent larger if the size of the non-metropolitan labor force had held steady, all else being equal”
Between August and September, unemployment rates fell in all of the state’s 14 metro areas. Rocky Mount had the highest unemployment rate (8.8 percent), followed by Fayetteville (7.1 percent) and Goldsboro, Jacksonville, and Hickory-Morganton-Lenoir (all at 6.5 percent). Asheville had the lowest unemployment rate (4.6 percent), followed by Durham-Chapel Hill (4.9 percent) and Raleigh-Cary (5 percent).
Compared to September 2013, unemployment rates in September 2014 were lower in 98 counties and all 14 metro areas. Over the year, however, labor force sizes decreased in 78 counties and in 9 metros. And the statewide labor force (seasonally adjusted) was 0.7 percent smaller (-31,038 individuals) in September 2014 than it was in September 2013.
Among metros, Rocky Mount’s labor force contracted at the fastest rate (-2.9 percent) over the course of the year, followed by Fayetteville (-2.3 percent) and Hickory-Morganton-Lenoir (-1.9 percent). With those changes, metro areas now are home to 72.3 percent of the state’s labor force, with 51.1 percent of the labor force residing in the Triangle, Triad, and Charlotte metros.
In the long term, improvements in overall labor market conditions depend on growth in the Charlotte, Research Triangle, and Piedmont Triad regions. Collectively, employment in the three metro regions has risen by 6.2 percent since December 2007, and the combined unemployment rate in September totaled 5.6 percent, as compared to 6 percent in September 2008. Of the three broad regions, the Research Triangle had the lowest unemployment rate (5.1 percent), followed by Charlotte (6.2 percent) and the Piedmont Triad (6.1percent).
The local employment report for September also provided insights into the effects of the extensive changes to the state’s system of unemployment insurance implemented in 2013. Last month, the number of regular unemployment insurance initial claims filed in North Carolina totaled 21,023, down from the 26,051 initial claims filed a year earlier (-19.3 percent).
Mecklenburg County was home to greatest number of regular initial claims (2,517), followed by Wake (1,767), Guilford (1,106), Cumberland (786), and Forsyth (698) counties.
In September 2014, North Carolinians received a (nominal) total of $36.3 million in regular state-funded and federal unemployment insurance compensation, down from the (nominal) $80.4 million received in September 2013. This decline (-54.9 percent) is attributable to a mix of factors, such as drops in the number of insurance claims resulting from economic improvements and legal changes that restricted eligibility for insurance compensation.
Additionally, the state’s decision to exit the federal Emergency Unemployment Compensation (EUC) program reduced the amount of federal unemployment insurance compensation flowing into the state. Between September 2013 and September 2014, the amount of federal unemployment insurance benefits paid to North Carolinians fell by 71.7 percent, dropping to a (nominal) total of $1.3 million from a (nominal) total of $4.6 million. (Note that the US Congress allowed the EUC program to expire at the start of 2014.)
“Even with recent improvements in certain important indicators, many local labor markets—non-metropolitan ones in particular—continue to underperform and have yet to recover from the last recession,” said Quinterno. “The September data were consistent with the basic pattern of slow growth that has characterized the state’s economy for the past 4.5 years.”
North Carolina Payrolls Expand In September
CHAPEL HILL, NC (October 21, 2014) – In September, employers in North Carolina added 14,000 more payroll jobs than they cut (+0.3 percent), due entirely to hiring in the private sector. The monthly household survey, meanwhile, recorded a drop in the unemployment rate to 6.7 percent, although the size of the labor force fell over the month. With last month’s changes in payroll levels, North Carolina now has approximately the same number of jobs as it did in December 2007, yet the state also has 35.7 percent more unemployed residents than it did 6.75 years ago, as well as an unemployment rate that is 1.7 percentage points higher.
These findings come from new data released today by the Labor and Economic Analysis Division of the NC Department of Commerce.
“The September employment report was consistent with the relatively uninspiring performance turned in by North Carolina’s labor market in recent years,” said John Quinterno, a principal with South by North Strategies, Ltd., a research firm specializing in economic and social policy. “North Carolina netted jobs in September, but the state also experienced declines in the size of the labor force and in the number of employed persons. While certain conditions in the state have improved over the last year, the labor market remains far from recovered.”
Between August 2014 and September 2014, North Carolina employers added 14,000 more jobs than they cut (+0.3 percent). Private-sector payrolls netted 16,700 positions (+0.5 percent), but public-sector payrolls lost, on net, 2,700 jobs (-0.4 percent), owing primarily to net reductions by state government (-3,200, -1.6 percent). Within private industry, the professional and business services sector netted the most jobs (+7,400, +1.3 percent), with 87.8 percent of that gain originating in the administrative and waste services subsector. The education and health services sector netted 4,700 jobs (+0.8 percent), followed by the finance sector (+4,000, +1.9 percent). Meanwhile, the leisure and hospitality services sector shed the most jobs (-2,700 jobs, -0.6 percent). All other major industrial sectors experienced modest changes in payroll sizes.
A revision to the August 2014 payroll data found that the state gained 2,300 more jobs that month than first estimated (+14,800 versus +12,500). With the revision, North Carolina now has, on net, slightly more payroll jobs (+2,000, +0.1 percent) than it did in December 2007, which is when the “Great Recession” began nationally. Since bottoming out in February 2010, the state has netted an average of 6,015 payroll jobs per month, resulting in a cumulative gain of 330,800 positions (+8.6 percent).
Note that the return of North Carolina’s payroll size to the pre-recession level does not mean that the state’s labor market has recovered. Over the past 6.75 years, North Carolina needed not only to replace the jobs lost during the recession, but also to add jobs to keep pace with the growth of the working-age population. By one estimate, North Carolina is 449,000 payroll jobs short of the number it should have added since late 2007 to accommodate population growth.
“Although 2014 has seen job growth across North Carolina, the pace of payroll growth remains moderate,” noted Quinterno. “Over the first nine months of the year, the state netted an average of 7,300 jobs per month, a pace that is insufficient to close the state’s job gap anytime soon.”
In contrast to the payroll data, the household data recorded in September painted a more negative picture of the state’s labor market. Last month, the statewide unemployment rate dipped to 6.7 percent from 6.8 percent, while the number of unemployed individuals fell by 4,563 (-1.4 percent). At the same time, the number of employed North Carolinians dropped slightly (-5,622, -0.1 percent). The decline in the unemployment rate therefore was attributable mathematically to a contraction in the size of the labor force (-10,185 persons, -0.2 percent).
Over the past year, the statewide unemployment rate fell by a full percentage point, dropping to 6.7 percent from 7.7 percent, with the number of unemployed North Carolinians decreasing by 49,243 persons (-13.7 percent). However, 63 percent of the decline was attributable to people who left the labor force entirely rather than those who became employed. If those 31,038 leavers from the labor force were added back and considered unemployed, the statewide unemployment rate in September would have equaled 7.3 percent. Even if 50 percent of those individuals were added back to the labor force and considered unemployed, the statewide unemployment rate would have equaled 7 percent.
Year-over-year declines in the statewide labor force participation rate provide additional evidence of a labor market with problematic underlying dynamics. In September, the share of working-age North Carolinians participating in the labor market was 60.3 percent, which was lower than the 61.5 percent figure logged a year ago, not to mention the lowest monthly rate recorded at any time since January 1976.
In addition, another important measure of labor utilization, the employment-to-population ratio, fell over the year, dropping to 56.3 percent from 56.7 percent. The current share of working-age North Carolinians with a job now is tied at the lowest level logged at any point since 1976.
The September labor market report provides additional insight into the effects of the extensive changes to the state’s system of unemployment insurance implemented in July 2013. Between August and September, the number of claimants of regular state-funded insurance fell by 6 percent, dropping to 37,107 from 39,466. Compared to a year earlier, 30,362 fewer individuals received regular state-funded insurance in September (-45 percent).
Also in September, the state paid a (nominal) total of $35 million in regular state-funded unemployment insurance compensation, an amount 53.8 percent lower than the (nominal) total of $75.8 million paid in September 2013.
“North Carolina netted jobs in September, but even with those gains, the state is not adding jobs at a rapid enough pace to keep pace with the growth in the working-age population,” added Quinterno. “At the same time, a look beyond recent drops in the unemployment rate will reveal a labor market with underlying dynamics inconsistent with those associated with a robust recovery.”
 Email Sign-Up