

North Carolina Payrolls Grow In October
CHAPEL HILL, NC (November 21, 2014) – In October, employers in North Carolina added 17,200 more payroll jobs than they cut (+0.4 percent), due mainly to hiring in the private sector. The monthly household survey, meanwhile, logged a drop in the unemployment rate to 6.3 percent. With last month’s net job growth, North Carolina now has slightly more jobs than it did in December 2007, yet the state also has 28.4 percent more unemployed residents than it did almost seven years ago, as well as an unemployment rate that is 1.3 percentage points higher.
These findings come from new data released today by the Labor and Economic Analysis Division of the NC Department of Commerce.
“The October employment report was consistent with the pattern of modest jobs growth that has characterized North Carolina’s slow recovery from the last recession,” said John Quinterno, a principal with South by North Strategies, Ltd., a research firm specializing in economic and social policy. “North Carolina netted jobs in October and now has slightly more jobs than it did in December 2007, but that is not the same thing as a full labor market recovery.”
Between September 2014 and October 2014, North Carolina employers added 17,200 more jobs than they cut (+0.4 percent). Private-sector payrolls netted 13,700 positions (+0.4 percent), and public-sector payrolls netted 3,500 jobs (+0.5 percent), owing primarily to hiring by local governments (+7,500, +1.7 percent). Within private industry, the education and health services sector netted the most jobs (+6,100, +1.1 percent), with all of the hiring originating in the health care and social services subsector. The leisure and hospitality sector netted 3,500 jobs (+0.8 percent, with 77.1 percent of the gain originating in the accommodation and food service subsector), followed by the other services sector (+2,300, +1.5 percent). Meanwhile, the finance sector shed the most jobs (-2,000 jobs, -0.9 percent). All other major industrial sectors experienced modest changes in payroll sizes.
A revision to the September 2014 payroll data found that the state gained 3,300 fewer jobs that month than first estimated (+10,700 versus +14,000). With the revision, North Carolina now has, on net, slightly more payroll jobs (+15,900, +0.4 percent) than it did in December 2007, which is when the “Great Recession” began nationally. Since bottoming out in February 2010, the state has netted an average of 6,155 payroll jobs per month, resulting in a cumulative gain of 344,700 positions (+9 percent).
Note that the return of North Carolina’s payroll size to the pre-recession level does not mean that the state’s labor market has recovered. Over the past 6.75 years, North Carolina has needed not only to replace the jobs lost during the recession, but also to add jobs to keep pace with the growth of the working-age population. By one estimate, North Carolina still is 441,000 payroll jobs short of the number it should have added since late 2007 to accommodate the 11 percent rate of population growth that has occurred since then. At the current pace of net job growth, it would take another 72 months to fill that gap, holding all else equal.
“Although North Carolina has experienced job growth in 2014, the pace of growth has been modest,” noted Quinterno. “Over the first 10 months of the year, payroll employment in North Carolina expanded by 1.9 percent. The comparable rate in 2013 was 2 percent, and in 2012, the comparable rate was 1.6 percent. These rates are consistent with a sluggish recovery.”
In contrast to the payroll data, the household data recorded October pointed to a labor market that has yet to recover the ground lost during the recession. Last month, the statewide unemployment rate dipped to 6.3 percent from 6.7 percent, while the number of unemployed individuals fell by 16,685 (-5.4 percent). At the same time, the number of employed North Carolinians rose (+17,508, +0.4 percent). And the size of the labor force essentially held steady at 4.6 million persons.
Over the year, the statewide unemployment rate fell by 1.2 percentage points, dropping to 6.7 percent from 7.5 percent, with the number of unemployed North Carolinians decreasing by 54,551 persons (-15.7 percent). However, 47.8 percent of the decline was attributable to people who left the labor force entirely rather than to those who became employed. If those 26,104 leavers from the labor force were added back and considered unemployed, the statewide unemployment rate in October would have equaled 6.8 percent. Even if 50 percent of those individuals were added back to the labor force and considered unemployed, the statewide unemployment rate would have equaled 6.6 percent.
Year-over-year declines in the statewide labor force participation rate provide additional evidence of a labor market with problematic underlying dynamics. In October, the share of working-age North Carolinians participating in the labor market was 60.3 percent, which was lower than the 61.3 percent figure logged a year ago and was tied for the lowest monthly rate recorded at any time since January 1976.
In addition, another important measure of labor utilization, the employment-to-population ratio, fell over the year, dropping to 56.5 percent from 56.8 percent. The current share of working-age North Carolinians with a job is just slightly above the lowest rate logged at any point since 1976.
The October labor market report provides additional insight into the effects of the extensive changes to the state’s system of unemployment insurance implemented in July 2013. Between September and October, the number of claimants of regular state-funded insurance fell by 10.3 percent, dropping to 33,283 from 37,107. Compared to a year earlier, 27,842 fewer individuals received regular state-funded insurance in October (-45.5 percent).
Also in October, the state paid a (nominal) total of $27.9 million in regular state-funded unemployment insurance compensation, an amount 53.7 percent lower than the (nominal) total of $60.2 million paid in October 2013.
“North Carolina netted jobs in October, but even with those gains, the state simply is not adding jobs at a rapid enough pace to keep pace with the growth in the working-age population, and that is why joblessness remains a problem across much of the state,” added Quinterno. “While the state now has the same number of jobs as it did when the last recession started, that development does not signal a full labor market recovery. On the contrary, weak job growth and joblessness remain significant problems.”
NC Unemployment Claims: Week Of 11/1/14
For the benefit week ending on November 1, 2014, North Carolinians filed some 5,702 initial claims for state unemployment insurance benefits and 41,189 claims for state-funded continuing benefits. Compared to the prior week, there were more initial claims and fewer continuing claims. These figures come from data released by the US Department of Labor.
Averaging new and continuing claims over a four-week period — a process that helps adjust for seasonal fluctuations and better illustrates trends — shows that an average of 5,178 initial claims were filed over the previous four weeks, along with an average of 42,708 continuing claims. Compared to the previous four-week period, the average number of initial claims was higher, and the average number of continuing claims was lower.
One year ago, the four-week average for initial claims stood at 6,573, and the four-week average of continuing claims equaled 70,488.
In recent months covered employment has increased and now exceeds the level recorded a year ago (3.92 million versus 3.85 million). Nevertheless, there are still fewer covered workers than there were in January 2008, which means that payrolls are smaller today than they were more than 6.5 years ago.
The graph (below right) shows the changes in unemployment insurance claims measured as a share of covered employment in North Carolina since the recession’s start in December 2007.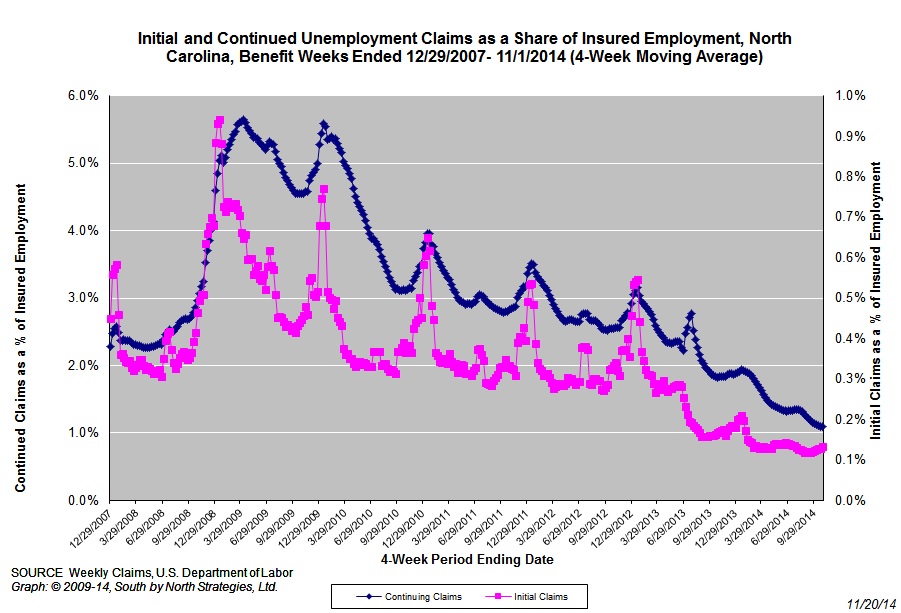
Both new and continuing claims have peaked for this cycle, and the four-week averages of new and continuing claims have fallen considerably. The four-week average of initial claims, when measured as a share of covered employment, is near the lowest level recorded since early 2008, while the four-week average of continuing claims is at the lowest level recorded since early 2008.
Note that the recent year-over-year declines in new and continuing claims are not necessarily indicative of an improving labor market. State legislation that took effect on July 1, 2013, made major changes to insurance eligibility criteria, and the more stringent criteria eliminate claims that would have been valid prior to July 1, 2013. Additionally, the legislation reduced the maximum number of weeks of state-funded insurance for which a claimant is eligible — an action that reduces the number of continuing claims.
To place the numbers in context, consider how the four-week average of initial claims (5,043) was 19.2 percent lower than the figure recorded one year ago (6,238), while the average number of continuing claims was 38.3 percent lower (43,613 versus 70,675). Given the modest rate of job growth that has occurred in North Carolina over the past year, such large declines likely are products of changes to unemployment insurance laws rather than improvements in underlying economic conditions.
Strengthening State Policies For Low-Income Working Families
In the summer of 2014, South by North Strategies, Ltd. prepared an overview of the impact of The Working Poor Families Project (WPFP), a national initiative to assess and strengthen state efforts to help low–income families advance and achieve economic security. To that end, the WPFP partners with nonprofit organizations in 22 states and the District of Columbia.
Among other findings, the project estimated that the WPFP and its state partners have generated or protected approximately $7.6 billion in state investments on behalf of low-income working families since 2002. These investments have occurred in the broad areas of postsecondary education and skills training; economic development; and social insurance and family benefits, with the bulk of the investments occurring in the area of postsecondary education and skills training.
Understanding & Using Regional Labor Market Information
In the summer of 2014, South by North Strategies developed a seven‐hour introductory course on labor market information for practitioners in local workforce development, economic development, and research organizations. The course was developed on behalf of the North Carolina Workforce Development Training Center, a unit within the North Carolina Department of Commerce.
The day-long course includes modules on “Labor Market Information in Context,” “Labor Market Information in Detail,” “Accessing Labor Market Information,” and “Talking about Labor Market Information,” as well as a practical group exercise. Sessions have been delivered in the North Carolina cities of Raleigh, Hickory, and Boone.
The course is based on material contained in South by North Strategies’ book “Running The Numbers: A Practical Guide to Regional Economic and Social Analysis” (Armonk, NY: M.E. Sharpe, 2014).
Using & Communicating Labor Market Information
In October 2014, South by North Strategies, Ltd. facilitated two 90-minute professional development sessions on ways of using and communicating regional labor market information. The sessions were delivered as part of the 2014 North Carolina Workforce Development Partnership Conference, an annual gathering of approximately 900 workforce development professional organized by the North Carolina Workforce Development Training Center.
The sessions took place on October 16, 2014 in Greensboro and were based on material covered in the book “Running The Numbers: A Practical Guide to Regional Economic and Social Analysis” (Armonk, NY: M.E. Sharpe, 2014).
 Email Sign-Up