National Employment Report: January
The national employment report for January points to a sickly labor market. Last month, employers eliminated 20,000 more payroll jobs than they added. Additionally, official revisions to 2009 estimates found that the economy lost 930,000 more jobs than first reported. Total job losses since Dec. 2007 now number 8.4 million.
In January, the nation’s employers eliminated 20,000 more payroll positions than they created. Although the November payroll data were revised upward (to +64,000 positions from +4,000), downward revisions to December data (to -150,000 from -85,000) more than offset the gains. And annual revisions to the 2009 estimates found that 930,000 more positions (seasonally adjusted) were lost than initially reported.
The extent of idle labor is reflected in the household data released today. In January, 14.8 million Americans – 9.7 percent of the labor force – were jobless and actively seeking work. Proportionally more adult male workers were unemployed than female ones (10 percent vs. 7.9 percent). Similarly, unemployment rates were higher among Black (16.5 percent) and Hispanic workers (12.6 percent) than among White ones (8.7 percent). The unemployment rate among teenagers was 26.4 percent.
Furthermore, newly available data show that 9.6 percent of all veterans were unemployed in January; the rate among veterans who had served since Sep. 2001 was 12.6 percent. Also, 15.2 percent of Americans with disabilities were unemployed last month.
Click here to read South by North Strategies full analysis of the January report.
New Year, Same Jobs Story
CHAPEL HILL (February 5, 2010) – The national employment report for January points to a sickly labor market. Last month, employers eliminated 20,000 more payroll jobs than they added. Additionally, official revisions to 2009 estimates found that the economy lost 930,000 more jobs than first reported. Total job losses since Dec. 2007 now number 8.4 million.
“The national labor market started 2010 just like it ended 2009: going nowhere,” said John Quinterno, a principal at South by North Strategies, Ltd., a research firm specializing in economic and social policy. “Labor market conditions have stabilized in recent months, but few meaningful improvements are occurring. The job market continues to drift along.”
In January, the nation’s employers eliminated 20,000 more payroll positions than they created. Although the November payroll data were revised upward (to +64,000 positions from +4,000), downward revisions to December data (to -150,000 from -85,000) more than offset the gains. And annual revisions to the 2009 estimates found that 930,000 more positions (seasonally adjusted) were lost than initially reported.
January job losses were concentrated in the construction (-75,000), transportation/warehousing (-19,000), and financial (-16,000) sectors. Losses primarily were offset by gains in professional and business services (+44,000), retail trade (+42,100), and education/health care (+16,000). Much of the increase in professional services employment was driven by the temporary help services sub-industry (+52,000).
“The best that can be said about the January employment report is that job losses are not occurring at the dizzying pace seen in early 2009,” added Quinterno. “Yet two years of recession have forced many Americans to the economy’s sidelines.”
The extent of idle labor is reflected in the household data released today. In January, 14.8 million Americans – 9.7 percent of the labor force – were jobless and actively seeking work. Proportionally more adult male workers were unemployed than female ones (10 percent vs. 7.9 percent). Similarly, unemployment rates were higher among Black (16.5 percent) and Hispanic workers (12.6 percent) than among White ones (8.7 percent). The unemployment rate among teenagers was 26.4 percent.
Furthermore, newly available data show that 9.6 percent of all veterans were unemployed in January; the rate among veterans who had served since Sep. 2001 was 12.6 percent. Also, 15.2 percent of Americans with disabilities were unemployed last month
“In January, just 58.4 percent of America’s working-age population was employed,” noted Quinterno. “Individuals looking for work are finding it increasingly difficult to obtain positions. Last month, 41 percent of all unemployed workers had been jobless for at least six months. Because the number of job seekers far exceeds the number of openings, many more individuals have given up on finding work. Counting those individuals and those working part-time on an involuntary basis brings the underemployment rate to 16.5 percent.”
Today’s national data suggest that another weak employment report is in store for North Carolina. Since the recession’s start, North Carolina employers have eliminated, on net, 248,000 positions, and the statewide unemployment rate has climbed to 11.2 percent.
“In recent months, job losses and unemployment have settled at extremely high levels,” observed Quinterno. “Given that the bulk of the nation’s economic activity hinges upon consumer expenditures, high levels of joblessness only serve as a drag on growth. Alarmingly, the one major positive contributor to growth in recent quarters – federal recovery spending – likely has achieved its maximum effect on growth rates and will begin phasing out in 2010.”
“Public-sector spending currently is the main force driving the economy, and it appears that private-sector conditions are too weak, by themselves, to support much growth,” warned Quinterno. “This suggests that sluggish growth and high levels of joblessness will remain a serious problem well into 2010.”
Unequal Income Growth, 1979-2009
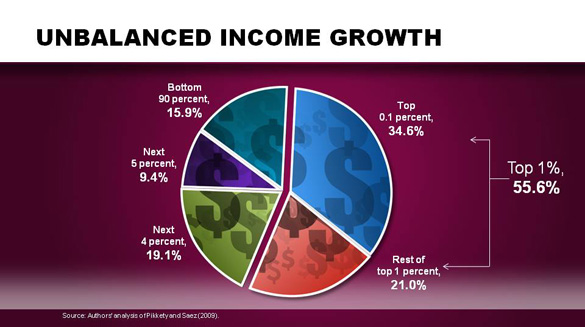
Updated data from the Economic Policy Institute trace the pattern of income growth between 1979 and 2009. As the graph below shows, 34.6% of all income growth over the past three decades has gone to the top one-tenth of 1% of all earners (some 13,000 families). The bottom 90% of all earners, meanwhile , has collectively seen only 15.9% of all income growth over the same period.
Around the Dial – Feb. 4
Economic policy reports, blog postings, and media stories of interest:
- Project Syndicate explains why an American recovery matters.
- The Wall Street Journal looks at changes in American manufacturing.
- Change Papers blogs about three factors that drive innovation.
- The Baseline Scenario separates budget sense from nonsense.
NC Unemployment Claims: Week of 1/16
For the benefit week ending on January 16th, 16,517 North Carolinians filed initial claims for state unemployment insurance benefits, and 204,078 individuals applied for state-funded continuing benefits. Compared to the prior week, there were fewer initial and continuing claims. (Note the filing week only had four days due to the Martin Luther King Jr. Day holiday.) These figures come from data released today by the U.S. Department of Labor.
Averaging new and continuing claims over a four-week period — a process that helps adjust for seasonal fluctuations and better illustrates trends — shows that an average of 30,020 initial claims were filed over the last four weeks, along with an average of 217,879 claims. Compared to the previous four-week period, both initial and continuing claims were higher.
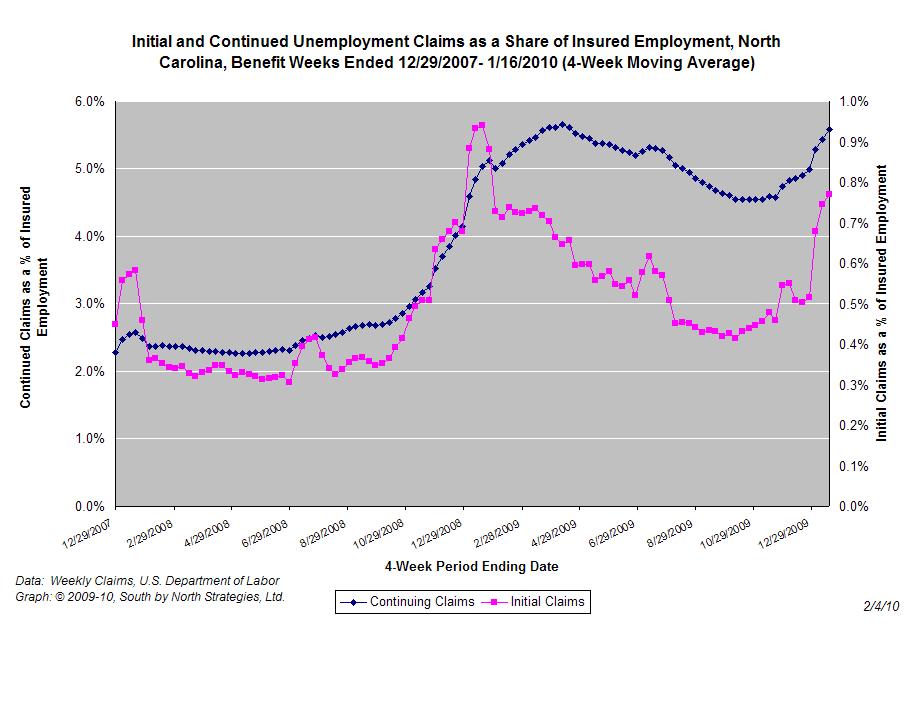
One year ago, the four-week average for initial claims stood at 37,912 and the four-week average of continuing claims equaled 203,249.
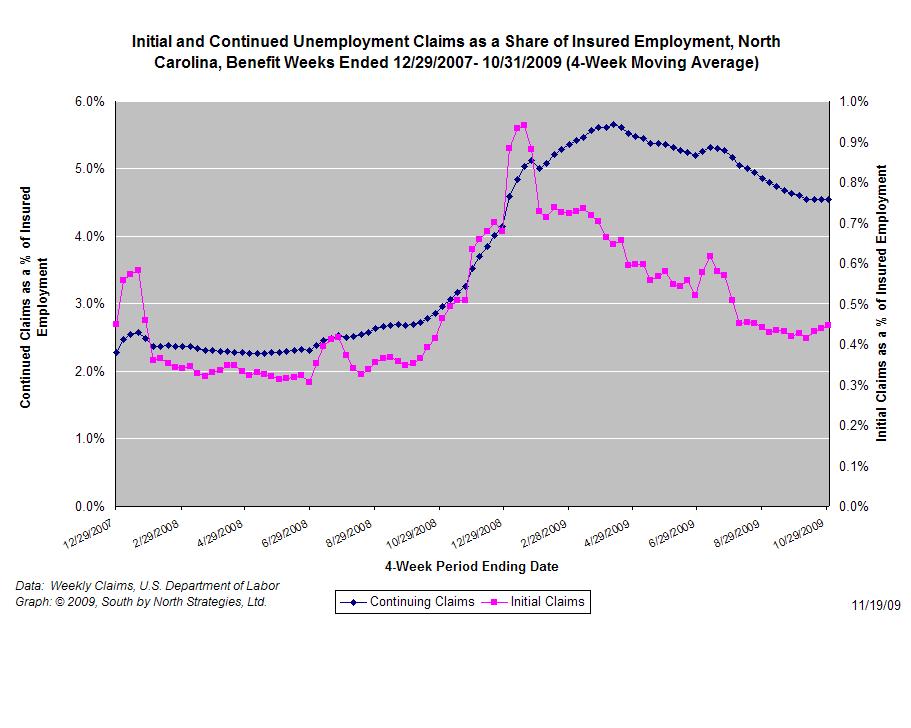
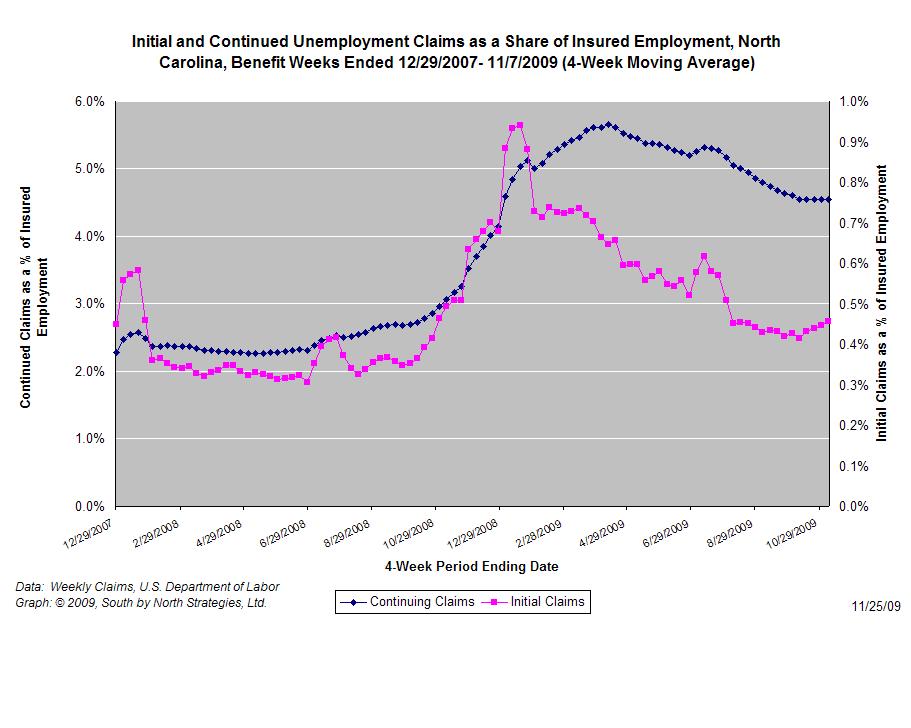
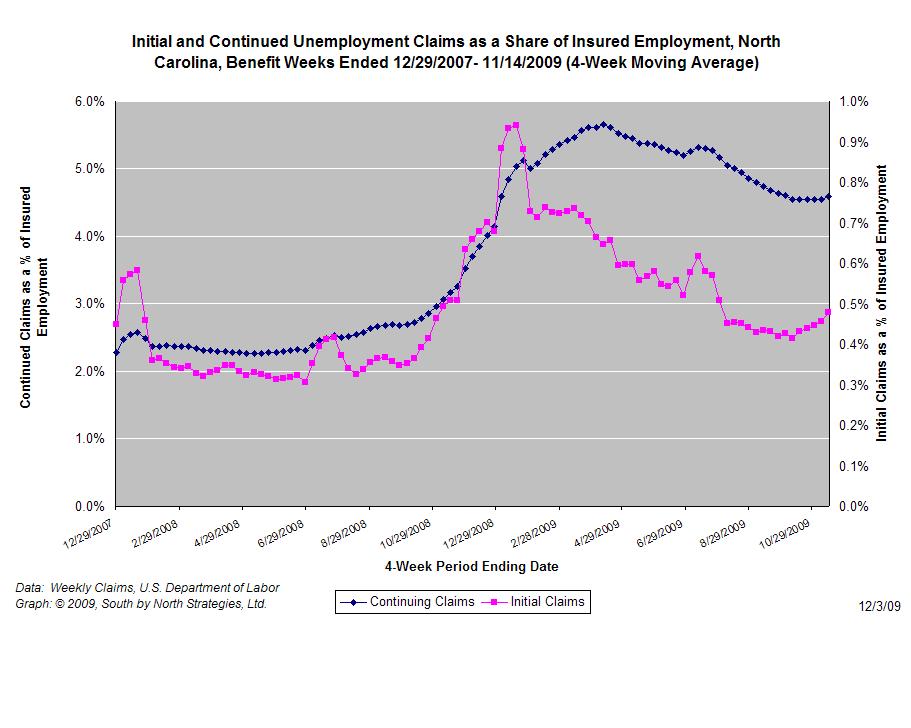
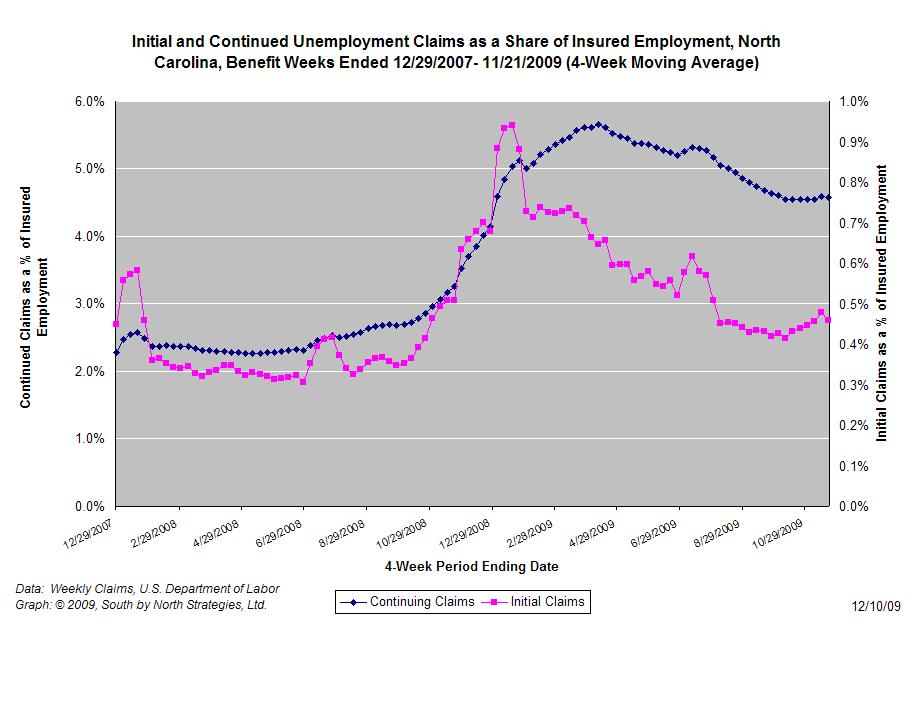
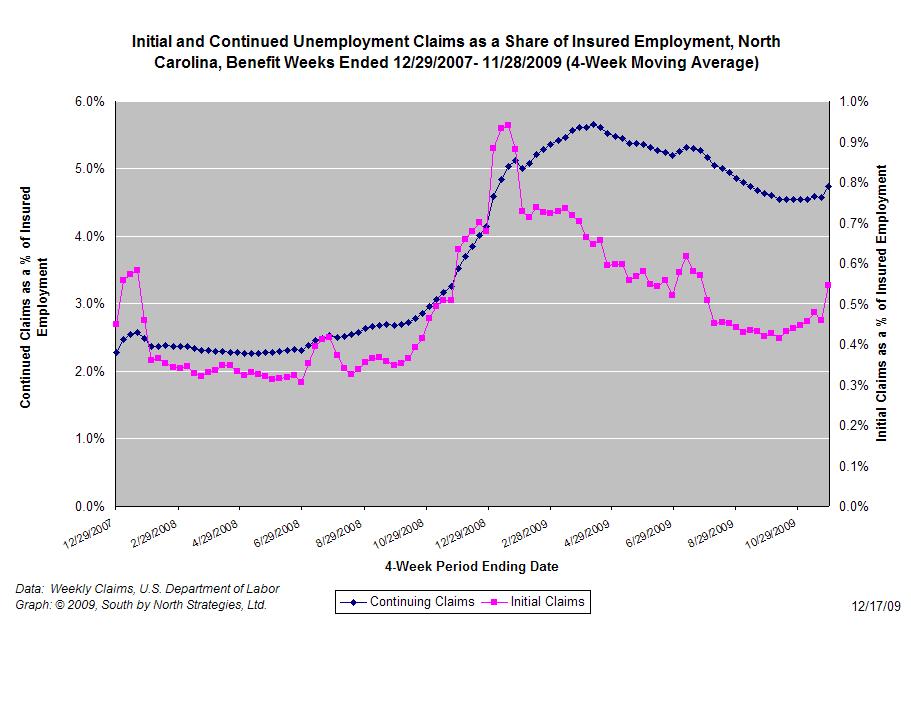
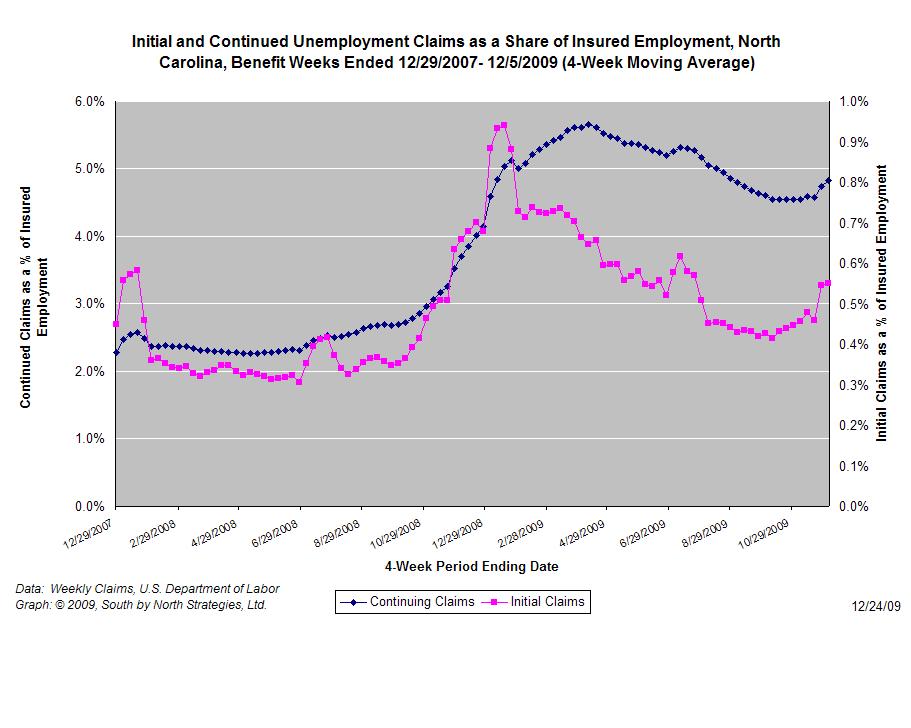
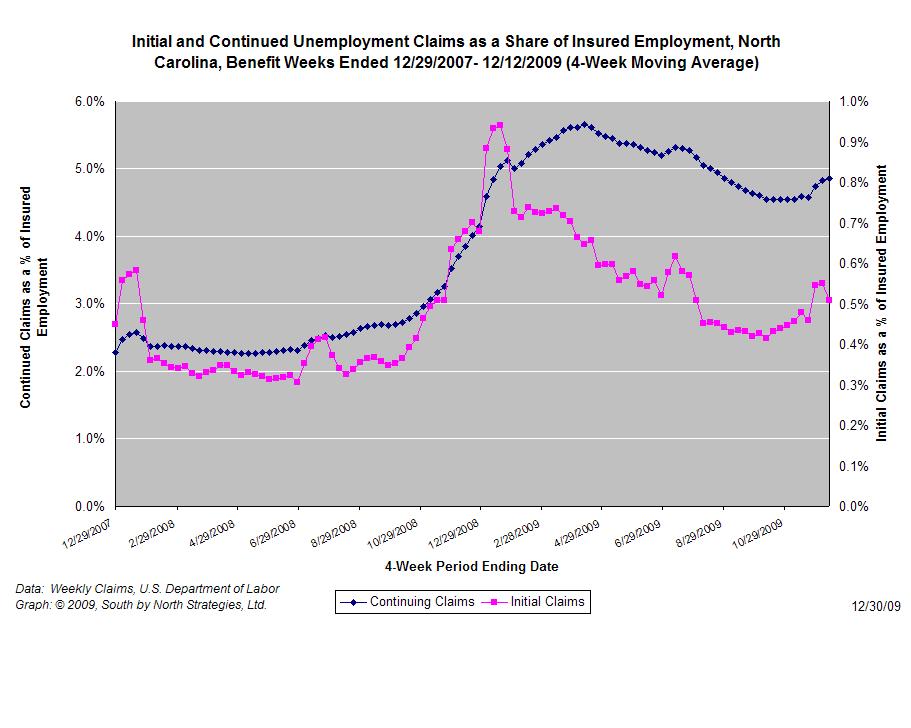
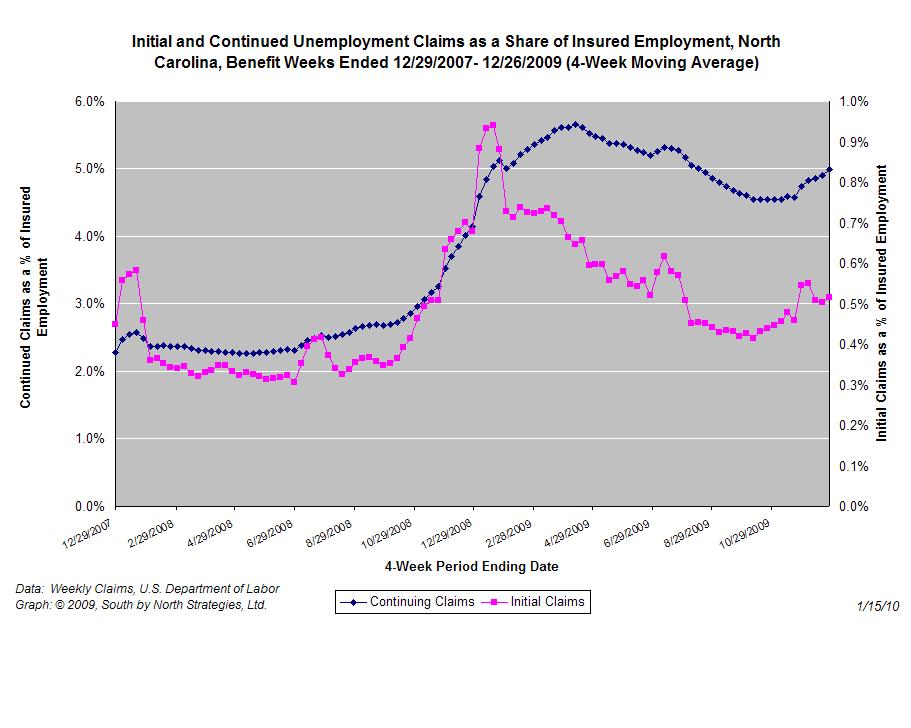
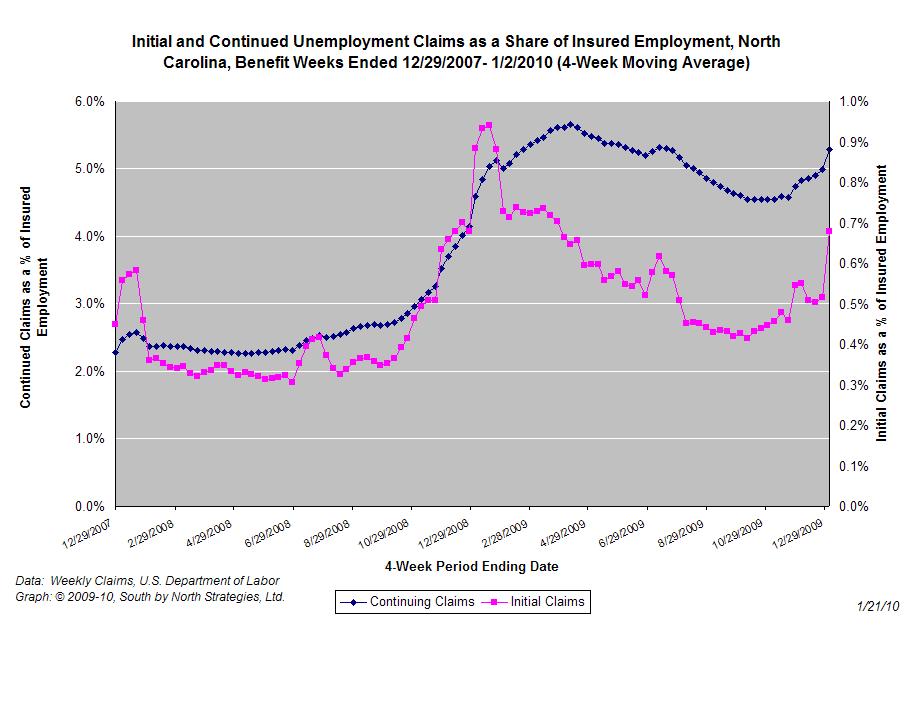
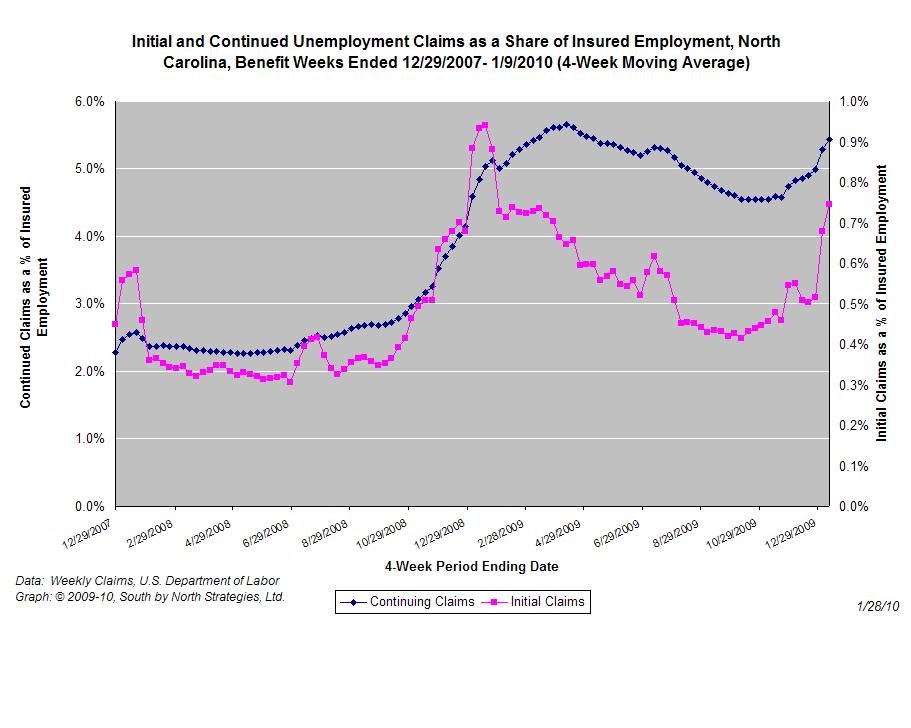
The graph (right) shows the changes in unemployment insurance claims (as a share of covered employment) in North Carolina since the recession’s start in December 2007.
Although new and continuing claims appear to have peaked for this business cycle, the claims levels remain elevated and point to a labor market that remains extremely weak. Especially troubling is the high level of continuing claims, which suggests that unemployed individuals are finding it extremely difficult to find new positions.
 Email Sign-Up
 RSS Feed