Local Employment Conditions: Oct.
October saw few positive changes in local employment conditions across North Carolina. Last month, 64 counties posted double-digit rates of unemployment; of those, 30 had unemployment rates of at least 12 percent.
In October, every part of the state experienced weak labor markets. Unemployment rates exceeded 10 percent in 64 counties, and in 30 counties, at least 12 percent of the labor force was jobless and actively seeking work. County unemployment rates ranged from 6 percent in Currituck County to 17.2 percent in Scotland County.
Unemployment also remained at elevated levels in all 14 of the state’s metropolitan areas. Six metros posted double-digit unemployment rates. The Hickory-Morganton-Lenoir area had the highest unemployment rate (14.5 percent) followed by Rocky Mount (13.7 percent). The lowest metro unemployment rate was 7.6 percent in Durham-Chapel Hill.
Labor markets also were weak in the state’s three largest metro areas. In October, the unemployment rate stood at 12.7 percent in Charlotte, 11.1 percent in the Piedmont Triad, and 8.4 percent in the Research Triangle. Compared to one year ago, all three major regions had unemployment rates that were at least 1.5 times greater, along with smaller labor forces. Moreover, much of the job creation that has occurred in these areas over the past year has been in the public sector and the education and health care – fields intimately tied to public financing.
Click here to read South by North Strategies’ analysis of the October employment report.
Local Job Markets Stuck in Place
CHAPEL HILL (December 1, 2009) – October saw few positive changes in local employment conditions across North Carolina. Last month, 64 counties posted double-digit rates of unemployment; of those, 30 had unemployment rates of at least 12 percent. These findings come from preliminary data released today by the Employment Security Commission.
“Since reaching a low point in July, North Carolina’s labor market has gained some jobs,” says John Quinterno, a principal at South by North Strategies, Ltd., a research firm specializing in economic and social policy. “Unfortunately, unemployment remains fixed at recessionary levels.”
The statewide labor market made minor progress in October. Last month, employers added 12,100 more positions than they eliminated. Private payrolls netted 6,300 positions and public payrolls gained 5,800 jobs. Since the recession’s onset, North Carolina has lost, on net, 238,100 payroll jobs – a number equivalent to 5.7 percent of all the jobs that existed in December 2007. Last month, 10.7 percent of the labor force was unemployed (unadjusted rate).
In October, every part of the state experienced weak labor markets. Unemployment rates exceeded 10 percent in 64 counties, and in 30 counties, at least 12 percent of the labor force was jobless and actively seeking work. County unemployment rates ranged from 6 percent in Currituck County to 17.2 percent in Scotland County.
Unemployment also remained at elevated levels in all 14 of the state’s metropolitan areas. Six metros posted double-digit unemployment rates. The Hickory-Morganton-Lenoir area had the highest unemployment rate (14.5 percent) followed by Rocky Mount (13.7 percent). The lowest metro unemployment rate was 7.6 percent in Durham-Chapel Hill.
“Fluctuations in local unemployment rates must be interpreted cautiously,” notes Quinterno. “The lack of seasonal adjustment limits the usefulness of month-to-month comparisons. Nor does the unemployment rate capture changes in the size of the labor force. Between September and October, for instance, unemployment rates rose in 74 counties, but labor forces contracted in 41 counties. Individuals who exit the labor force are not included in the official count, so the decision of large numbers of individuals to abandon job searches can lead to an understatement of joblessness.”
The more accurate comparison is to contrast local data from October 2009 to October 2008. In every North Carolina county and metro area, unemployment rates were higher in October than they were a year ago. And compared to a year ago, 55 counties and 13 metro areas had smaller labor forces. Among metropolitan areas, Jacksonville posted the largest decline in the size of its labor force (-4.4 percent), followed by Asheville and Greensboro-High Point (both down by 2.1 percent).
“Even with some positive October data, private-sector hiring remains anemic, especially in the state’s three largest metropolitan areas. While the federal recovery package has prevented greater deterioration in local job markets, no recovery will occur without robust job growth in the state’s three major metros.”
In October, the unemployment rate stood at 12.7 percent in Charlotte, 11.1 percent in the Piedmont Triad, and 8.4 percent in the Research Triangle. Compared to one year ago, all three major regions had unemployment rates that were at least 1.5 times greater, along with smaller labor forces. Moreover, much of the job creation that has occurred in these areas over the past year has been in the public sector and the education and health care – fields intimately tied to public financing.
“Right now there is a tremendous amount of idle labor in North Carolina,” says Quinterno “Even though payroll employment has improved slightly in recent months, the level of growth is insufficient to bring down joblessness.”
“The best that can be said about local labor markets in North Carolina is that conditions appear to have stabilized,” adds Quinterno. “It appears as if local job markets will be going nowhere fast anytime soon.”
Service Activity in the South Atlantic: Nov.
From the Federal Reserve Bank of Richmond’s October survey of service-sector activity in the South Atlantic (District of Columbia, Maryland, North Carolina, South Carolina, Virginia and West Virginia):
Activity in the service sector contracted more slowly in November, according to the latest survey by the Federal Reserve Bank of Richmond. The fall in retail sales halted and shopper traffic declined only slightly. In addition, the contraction in big-ticket sales slowed, owing in part to an uptick in sales of new and used automobiles. Inventory reductions nearly matched last month’s. Revenues at services firms contracted; however, the decline was not as widespread as in October. Looking ahead six months, survey respondents were much more optimistic about business prospects than they were last month.
…
Turning to service sector labor markets, job cuts diminished at retail establishments, while the number of employees edged up at services firms. Average wage growth flattened. Price change in the overall service sector turned mildly negative, damped by continuing modest price deflation at services firms. Merchants anticipated an uptick in retail price growth during the next six months, while survey respondents at services firms looked for little price change.
Around the Dial – Nov. 30
Economic policy reports, blog postings, and media stories of interest:
- The New York Times analyzes trends in Food Stamp usage.
- At Project Syndicate, Brad DeLong asks why good policies are bad politics.
- In The Financial Times, Martin Wolf prays for fiscal austerity, but not now.
- The Economic Policy Institute calls for state budget relief.
- In The Nation, Chris Hayes breaks down the “China debt dance.”
Housing Price Indicies: Sept.
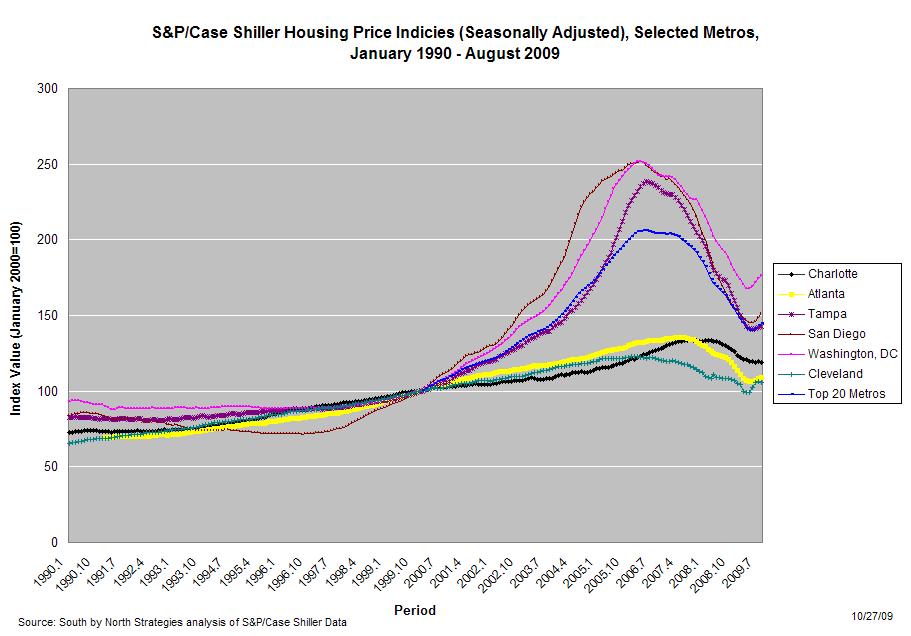
In September, the seasonally-adjusted home prices of single-family units rose in 11 of the 20 metro areas tracked by the S&P/Case-Shiller Housing Price Indicies. Despite those increases, sales price levels in all 20 markets remain significantly lower than they were one year ago. 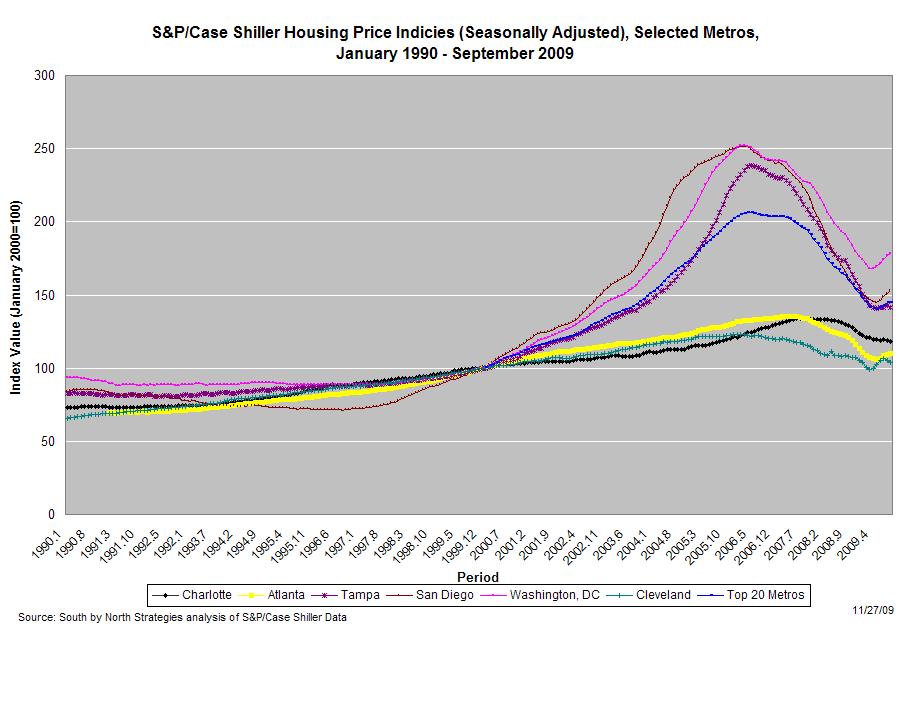
The graph (right) shows changes in price indices for selected metros. Data are shown for Charlotte, certain peer metros in the South Atlantic, and, for purposes of regional comparisons, San Diego and Cleveland. The composite measure for all 20 metros also is shown.
While Charlotte never experienced the same housing bubble seen in other metros, housing prices, as measured by the index, have fallen by 8.1 percent over the past year. And Charlotte was one of nine metros tracked in the survey that recorded a month-to-month decline in prices. Although most of the price tracked by the S&P.Case-Shiller Indicies have risen over the past few months, those trends don’t necessarily mean that the housing bubble has fully deflated. Explains Calculated Risk:
It appears that house prices – in general – are still too high. However prices depend on the local supply and demand factors. In many lower priced bubble areas supply has declined sharply (because of the loan modification efforts and local moratoria), and demand was very strong in Q3 from the first-time home buyer frenzy and cash flow investors. This has pushed up prices at the low end, and suggests price might fall some again at the low end – although probably not to new lows.
…
However in the mid-to-high end of the bubble areas – with significant supply and little demand – prices are still too high.
 Email Sign-Up
 RSS Feed