Policy Points
28.08.2013
News Releases, Policy Points
CHAPEL HILL, NC (August 28, 2013) – Between July 2012 and July 2013, unemployment rates fell in 97 of North Carolina’s 100 counties and in all of the state’s 14 metropolitan areas. Over that same period, the size of the labor force decreased in 70 counties and in 7 metro areas. These findings come from new estimates released by the Labor and Economic Analysis Division of the North Carolina Department of Commerce.
“Local unemployment rates throughout North Carolina have fallen over the course of 2013,” said John Quinterno, a principal with South by North Strategies, Ltd., a research firm specializing in economic and social policy. “Unemployment rates nevertheless remain elevated, with 38 counties and 3 metro areas posting unemployment rates of at least 10 percent. In July 2008, in contrast, three counties and no metro areas logged unemployment rates of at least 10 percent.”
Compared to December 2007, which is when the national economy fell into recession, North Carolina now has 2.7 percent fewer jobs (-114,400) and has seen its unadjusted unemployment rate climb to 9.1 percent from 4.7 percent. In July, the state gained 8,200 more jobs than it lost (+0.2 percent). Since bottoming out in February 2010, the state’s labor market has netted some 5,205 jobs per month, resulting in a cumulative gain of 213,400 positions (+5.6 percent).
Between June 2013 and July 2013, local unemployment rates decreased in 81 of the state’s 100 counties, rose in nine counties, and held steady in 10 counties. Individual county rates ranged from 5.3 percent in Currituck County to 16 percent in Scotland County. Overall, 38 counties posted unemployment rates greater than or equal to 10 percent, and 55 counties posted rates between 7 and 9.9 percent.
“Non-metropolitan labor markets continue to struggle relative to metropolitan ones,” noted Quinterno. “In July, 10 percent of the non-metro labor force was unemployed, compared to 8.7 percent of the metro labor force. Compared to December 2007, the non-metro labor force now has 4.7 percent fewer employed persons, while the number of unemployed individuals is 81.2 percent larger.”
Over the month, unemployment rates fell in 12 metro areas, rose in one, and held steady in one. Rocky Mount had the highest unemployment rate (13.3 percent), followed by Fayetteville (10.6 percent) and Hickory-Morganton-Lenoir (10 percent). Asheville had the lowest unemployment rate (6.8 percent), followed by Durham-Chapel Hill (7.1 percent) and Raleigh-Cary (7.3 percent).
Compared to July 2012, unemployment rates in July 2013 were lower in 97 counties and 14 metro areas. Over the year, however, labor force sizes decreased in 70 counties and in 7 metros. Among metros, Hickory-Morganton-Lenoir’s labor force contracted at the greatest rate (-1.6 percent), followed by Rocky Mount (-1.1 percent). With those changes, metro areas now are home to 71.7 percent of the state’s labor force, with 50.3 percent of the labor force residing in the Triangle, Triad, and Charlotte metros.
In the long term, improvements in overall labor market conditions depend on growth in the Charlotte, Research Triangle, and Piedmont Triad regions. Yet growth in these metros remains muted. Collectively, employment in those three metro regions has risen by 3.3 percent since December 2007, and the combined July unemployment rate in the three regions equaled 8.5 percent. That was down from the 9.4 percent rate recorded one year ago yet was well above the 6.2 percent rate recorded in July 2008. Of the three broad regions, the Research Triangle had the lowest July unemployment rate (7.5 percent), followed by Charlotte and the Piedmont Triad (both 9.2 percent).
“Approximately 3.5 years into a recovery in North Carolina’s labor market, unemployment rates remain extremely elevated across the state,” said Quinterno. “The first half of 2013 was the most disappointing one for job growth since the onset of the recovery, and 2013 currently is shaping up to be the worst year for labor markets in North Carolina since the onset of the recovery.”
22.08.2013
Policy Points
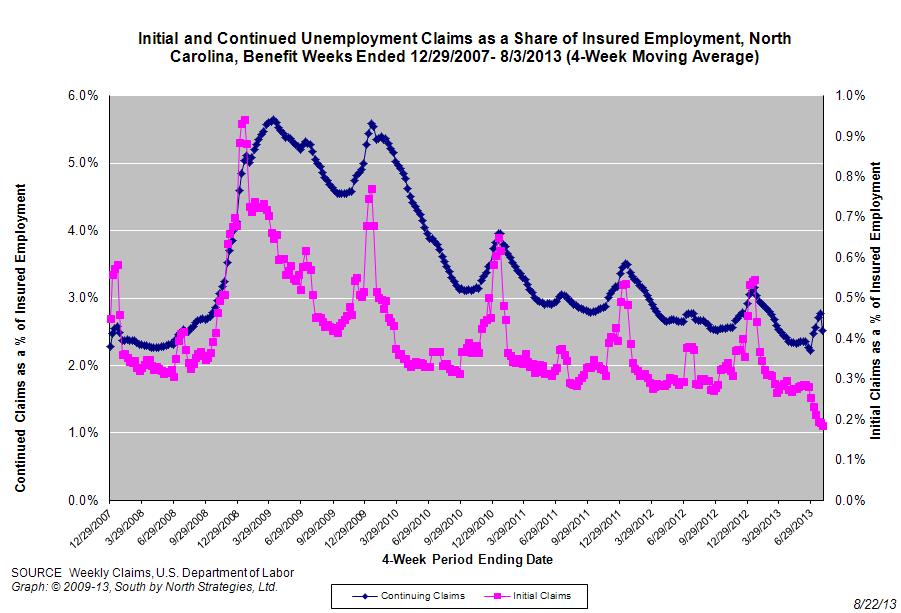
For the benefit week ending on August 3, 2013, some 7,323 North Carolinians filed initial claims for state unemployment insurance benefits and 89,864 individuals applied for state-funded continuing benefits. Compared to the prior week, there were more initial claims and fewer continuing claims. These figures come from data released by the US Department of Labor.
Averaging new and continuing claims over a four-week period — a process that helps adjust for seasonal fluctuations and better illustrates trends — shows that an average of 7,081 initial claims were filed over the previous four weeks, along with an average of 96,874 continuing claims. Compared to the previous four-week period, the average number of initial claims was lower, as was the average number of continuing claims.
One year ago, the four-week average for initial claims stood at 10,856, and the four-week average of continuing claims equaled 100,857.
In recent months covered employment has increased and now exceeds the level recorded a year ago (3.84 million versus 3.77 million). Nevertheless, there are still fewer covered workers than there were in January 2008, which means that payrolls are smaller today than they were some 5.5 years ago.
The graph (right) shows the change s in unemployment insurance claims measured as a share of covered employment in North Carolina since the recession’s start in December 2007.
Both new and continuing claims appear to have peaked for this cycle, and the four-week averages of new and continuing claims have fallen considerably. In fact, the four-week average of initial claims, when measured as a share of covered employment, is now near the lowest level recorded since early 2008. Yet continuing claims remain at an elevated level, which suggests that unemployed individuals are finding it difficult to find new positions.
20.08.2013
News Releases, Our Projects, Policy Points
In August 2013, the NC Center for Public Policy Research, a nonprofit organization in Raleigh, released the first comprehensive analysis of the approximately 10,000-person workforce employed in North Carolina’s public facilities that provide mental health, developmental disability, and substance  abuse services.
The report provides a snapshot of selected demographic, occupational, and employment characteristics of the workforce employed in North Carolina’s three public psychiatric hospitals, three alcohol and drug treatment centers, three developmental centers for persons with intellectual and developmental disabilities, two residential treatment centers for children, three neuro-medical treatment centers, and the central administrative office.
An overview of the analysis and a summary of key findings are available here.
John Quinterno of South by North Strategies, Ltd. conducted the basic analysis, which involved a descriptive analysis of administrative data provided by the NC Division of Mental Health, Developmental Disabilities, and Substance Abuse Services. The data reflect the employment situation as of summer 2012.
The research is part of a longer, multi-year study of mental health reform in North Carolina that the NC Center for Public Policy Research has been conducting thanks to generous philanthropic support. Past reports in the series, including a 2012 piece prepared by South by North Strategies, are available for purchase in the online archives of the center’s research journal, North Carolina Insight.
19.08.2013
News Releases, Policy Points
CHAPEL HILL, NC (August 19, 2013) – In July, employers in North Carolina added 8,200 more payroll positions than they eliminated (+0.2 percent). While that monthly gain was the second-largest one recorded so far in 2013, it was insufficient to drive down unemployment in the state. Both the unemployment rate and the number of unemployed persons actually rose over the month, while the number of employed persons fell to the lowest level recorded since August 2012.
These findings come from new data released today by the Labor and Economic Analysis Division of the NC Department of Commerce.
“July was yet another disappointing month for North Carolina’s labor market,” said John Quinterno, a principal with South by North Strategies, Ltd., a research firm specializing in economic and social policy. “While the private sector recorded its best month of job growth so far this year, payroll cuts in the public sector erased nearly 40 percent of that gain.”
In July, North Carolina employers added 8,200 more jobs than they cut (+0.2 percent). That monthly change was the second-largest one recorded so far in 2013, exceeded only by a gain of 14,100 jobs in January. Last month, private-sector payrolls netted 13,500 positions (+ 0.4 percent), while public-sector payrolls shed 5,300 jobs (- 0.7 percent) due entirely to cuts by state and local governments. Within the private sector, the trade, transportation, and utilities sector netted the most jobs (+5,200, +0.7 percent), with 59.6 percent of the gain originating in the retail trade subsector. Leisure and hospitality services added, on net, 2,700 positions (+0.6 percent), with all of the gain occurring in the accommodation and food service subsector. Every other private-sector industry added jobs, with the exceptions of natural resources and mining (no change) and education and health services (-700 jobs, -0.1 percent).
A revision to the June payroll data found that the state gained fewer jobs than first estimated (+2,700 compared to +5,700). With that revision, North Carolina now has, on net, 114,400 fewer payroll positions (-2.7 percent) than it did in December 2007. Since bottoming out in February 2010, the state has netted an average of 5,200 payroll jobs per month, resulting in a cumulative gain of 213,400 positions (+5.6 percent). Additionally, the overall net gain of 13,100 jobs (+0.3 percent) recorded during the first six months of 2013 was the worst first-half figure for job growth in both absolute and relative terms posted so far during the economic recovery.
“North Carolina has experienced relatively little net payroll growth during 2013,” noted Quinterno. “The net gain of 21,300 jobs recorded during the first seven months of the year is 49.3 percent lower than the number netted during the first seven month of 2012. For North Carolina to net as many jobs in 2013 as it did in all of 2012, the state would need to net an average of 13,700 jobs per month for the rest of the year. The last time the state averaged roughly comparable growth during the last five months of a year was in 2006.”
The household data for July also pointed to the existence of a sputtering labor market. Last month, the number of unemployed persons rose (+1,527, +0.4 percent), and the number of employed persons fell (-13,735, -0.3 percent). The unemployment rate increased to 8.9 percent, which was the highest figure recorded since April, when the rate also equaled 8.9 percent.
Since the start of 2013, North Carolina has experienced a steady decline in the size of its labor force, as well as a drop in the number of employed persons. The size of the labor force has fallen to the lowest level recorded since January 2012, and the number of employed persons is at the lowest level posted since August 2012. While both the number of unemployed North Carolinians and the statewide unemployment rate have fallen during 2013, the improvements are largely attributable to people leaving the labor market rather than finding new positions.
The ongoing slides in two major measures of labor utilization offer additional evidence of sagging labor market conditions. In July, the labor force participation rate fell for the sixth-consecutive month, and the current rate of 62 percent is the lowest monthly figure recorded at any point since January 1976. Similarly, the employment-to-population ratio fell again in July to 56.5 percent, a level only slightly above the 37-year low of 56.3 percent posted in late 2011.
July’s labor market report further is significant because it is the first measure of the state’s labor market to have occurred since the implementation of extensive changes to the state’s system of unemployment insurance compensation. While the number of unemployed persons and the statewide unemployment rate rose from June to July, the number of new initial insurance claims fell by 24.2 percent. Moreover, the number of individuals receiving regular state-funded insurance compensation (new and continuing claims) fell by 10.5 percent from June to July.
“North Carolina’s labor market remains battered and bruised,” observed Quinterno. “While the private sector added jobs in July, that growth was too modest to alter radically the labor market situation. Too many labor market indicators either are under-performing or are moving in the wrong direction. 2013 is well on track to be the worst year for job growth since the onset of the economic recovery.”
15.08.2013
Policy Points
For the benefit week ending on July 27, 2013, some 6,958 North Carolinians filed initial claims for state unemployment insurance benefits and 94,644 individuals applied for state-funded continuing benefits. Compared to the prior week, there were more initial claims and fewer continuing claims. These figures come from data released by the US Department of Labor.
Averaging new and continuing claims over a four-week period — a process that helps adjust for seasonal fluctuations and better illustrates trends — shows that an average of 7,374 initial claims were filed over the previous four weeks, along with an average of 106,593 continuing claims. Compared to the previous four-week period, the average number of initial claims was lower, and the average number of continuing claims was higher.
One year ago, the four-week average for initial claims stood at 14,071, and the four-week average of continuing claims equaled 104,573.
In recent months covered employment has increased and now exceeds the level recorded a year ago (3.84 million versus 3.77 million). Nevertheless, there are still fewer covered workers than there were in January 2008, which means that payrolls are smaller today than they were some 5.5 years ago.
The graph (right) shows the change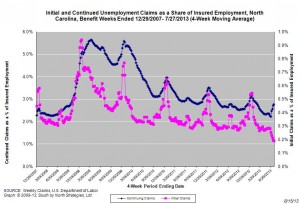 s in unemployment insurance claims measured as a share of covered employment in North Carolina since the recession’s start in December 2007.
Both new and continuing claims appear to have peaked for this cycle, and the four-week averages of new and continuing claims have fallen considerably. In fact, the four-week average of initial claims, when measured as a share of covered employment, is now at the lowest level recorded since early 2008. Yet continuing claims remain at an elevated level, which suggests that unemployed individuals are finding it difficult to find new positions.


 Email Sign-Up