14.08.2013
News Releases, Policy Points
(August 14, 2013) — “Running the Numbers: A Practical Guide to Regional Economic and Social Analysis” now is available for pre-order in all global markets.
Written by John Quinterno, the founder and principal of South by North Strategies, Ltd., a research consultancy specializing in economic and social policy, the book will be published in December 2013 by M.E. Sharpe, Inc., an award-winning independent publisher of books and journals in the social sciences and humanities.
Through use of practical examples and a plainspoken narrative style that minimizes the use of math, “Running the Numbers” demystifies data concepts, sources, and methods for public service professionals interested in understanding economic and social issues at the regional level. By blending elements of a general interest book, a textbook, and a reference book, “Running the Numbers” equips civic leaders, public administrators, urban planners, nonprofit executives, philanthropists, journalists, and graduate students in various disciplines to wield social and economic data for the benefit of their communities.
“Running the Numbers” focuses specifically on regions and explores a wide array of topics of regional importance, such as economic output, demographics, business structure, labor markets, income, and poverty, to name but a few. To that end, the book stresses practical applications, minimizes the use of math, and employs extended, chapter-length examples that demonstrate how analytical tools can illuminate the social and economic characteristics of actual regions, primarily those in the United States. Detailed information about the book’s contents is available online.
The hardcover and paperback editions of “Running the Numbers” now are available for pre-order through mesharpe.com (all global markets), barnesandnoble.com (USA), Amazon.com (USA), and Amazon sites in Canada, the United Kingdom, Germany, France, and Japan. Direct links to the online bookstores accepting pre-orders are available here.
Pre-ordered copies will ship in December consistent with the policies of the individual bookstores.
Suggested list prices are USD $42.95 (CAD $44.91 / GBP £27.64 / EUR €34.99) for the paperback edition and USD $89.95 (CAD $94.06 / GBP £57.88 / EUR €71.99) for the hardcover edition.
To stay current with information about the release of “Running the Numbers,” subscribe to email updates on the book’s home page or follow its page on Facebook.
07.08.2013
Biannual Jobs Review, News Releases, Policy Points
(August 8, 2013) – North Carolina’s labor market recorded little net employment growth (seasonally adjusted) over the first six months of 2013. During the first half of the year, the state gained 16,100 more payroll jobs than it lost (+0.4 percent). The private sector accounted for all of the net job growth. Moreover, all of the net job growth experienced so far in 2013 occurred during the year’s first three months; in fact, the state experienced no net job growth during the second quarter of 2013.
Given such weak job growth, relatively little progress was made against unemployment. While the number of unemployed individuals and the unemployment rate fell during the first half of 2013, those drops were intertwined with a 1.2 percent decline in the size of the state’s labor force. Compared to a year ago, 4,441 fewer North Carolinians were part of the labor force (-0.1 percent). And compared to five years earlier, only 6,049 more North Carolinians were employed in June (+0.1 percent), while 140,765 more persons were unemployed (+51 percent).
Six Months of Slow Job Growth
During the first six months of 2013, business establishments in North Carolina added 16,100 more payroll jobs than they shed (+0.4 percent). The private sector drove that growth by netting 16,900 positions (+0.5 percent), but the public sector shed 800 more positions than it gained (-0.1 percent). With those changes, North Carolina’s public sector (federal, state, and local) employs 5,800 fewer persons (-0.8 percent) than it did in June 2008. All of the public-sector losses occurred in the state government and local government subsectors, both of which now have fewer positions than they did five years ago.
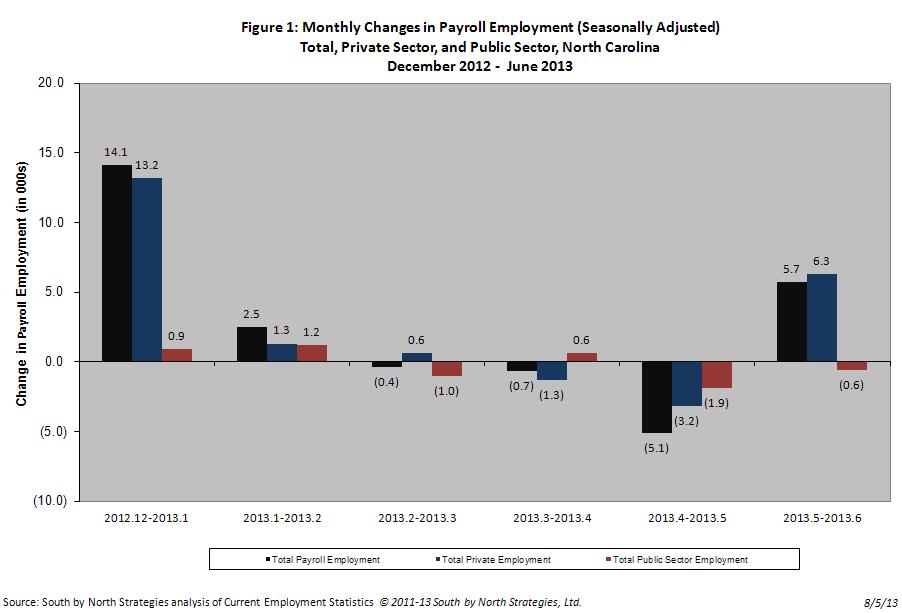
Fig. 1 shows, the monthly pattern of job growth in 2013. When the monthly totals are grouped into calendar quarters, distinct patterns emerge. In Q1 (Jan.-Mar.), private payrolls gained 15,100 more positions than they lost (+0.5 percent), and public payrolls netted 1,100 jobs (+0.2 percent), resulting in a net gain of 16,200 jobs (+0.4 percent). In Q2 (Apr.-Jun.), private-sector growth slowed (+1,800 jobs, +0.1 percent), and public-sector employers shed 1,900 positions (-0.3 percent), leading to a net loss of 100 jobs (+/- 0 percent). The cumulative result was a six-month net gain of 16,100 jobs.

The first half of 2013 was the most disappointing one for net job growth in North Carolina since the onset of the recovery. The net gain of 16,100 jobs was 64.4 percent smaller than the gain recorded during the first half of 2012, 23.7 percent lower than the gain recorded during the first half of 2011, and 34.8 percent smaller than the gain recorded during the first half of 2010. The 0.4 percent rate of net job growth logged during the first half of 2013 also was lower than the growth rates posted during the first halves of 2012, 2011, and 2010 (+1.2 percent, +0.5 percent, and +0.6 percent, respectively).
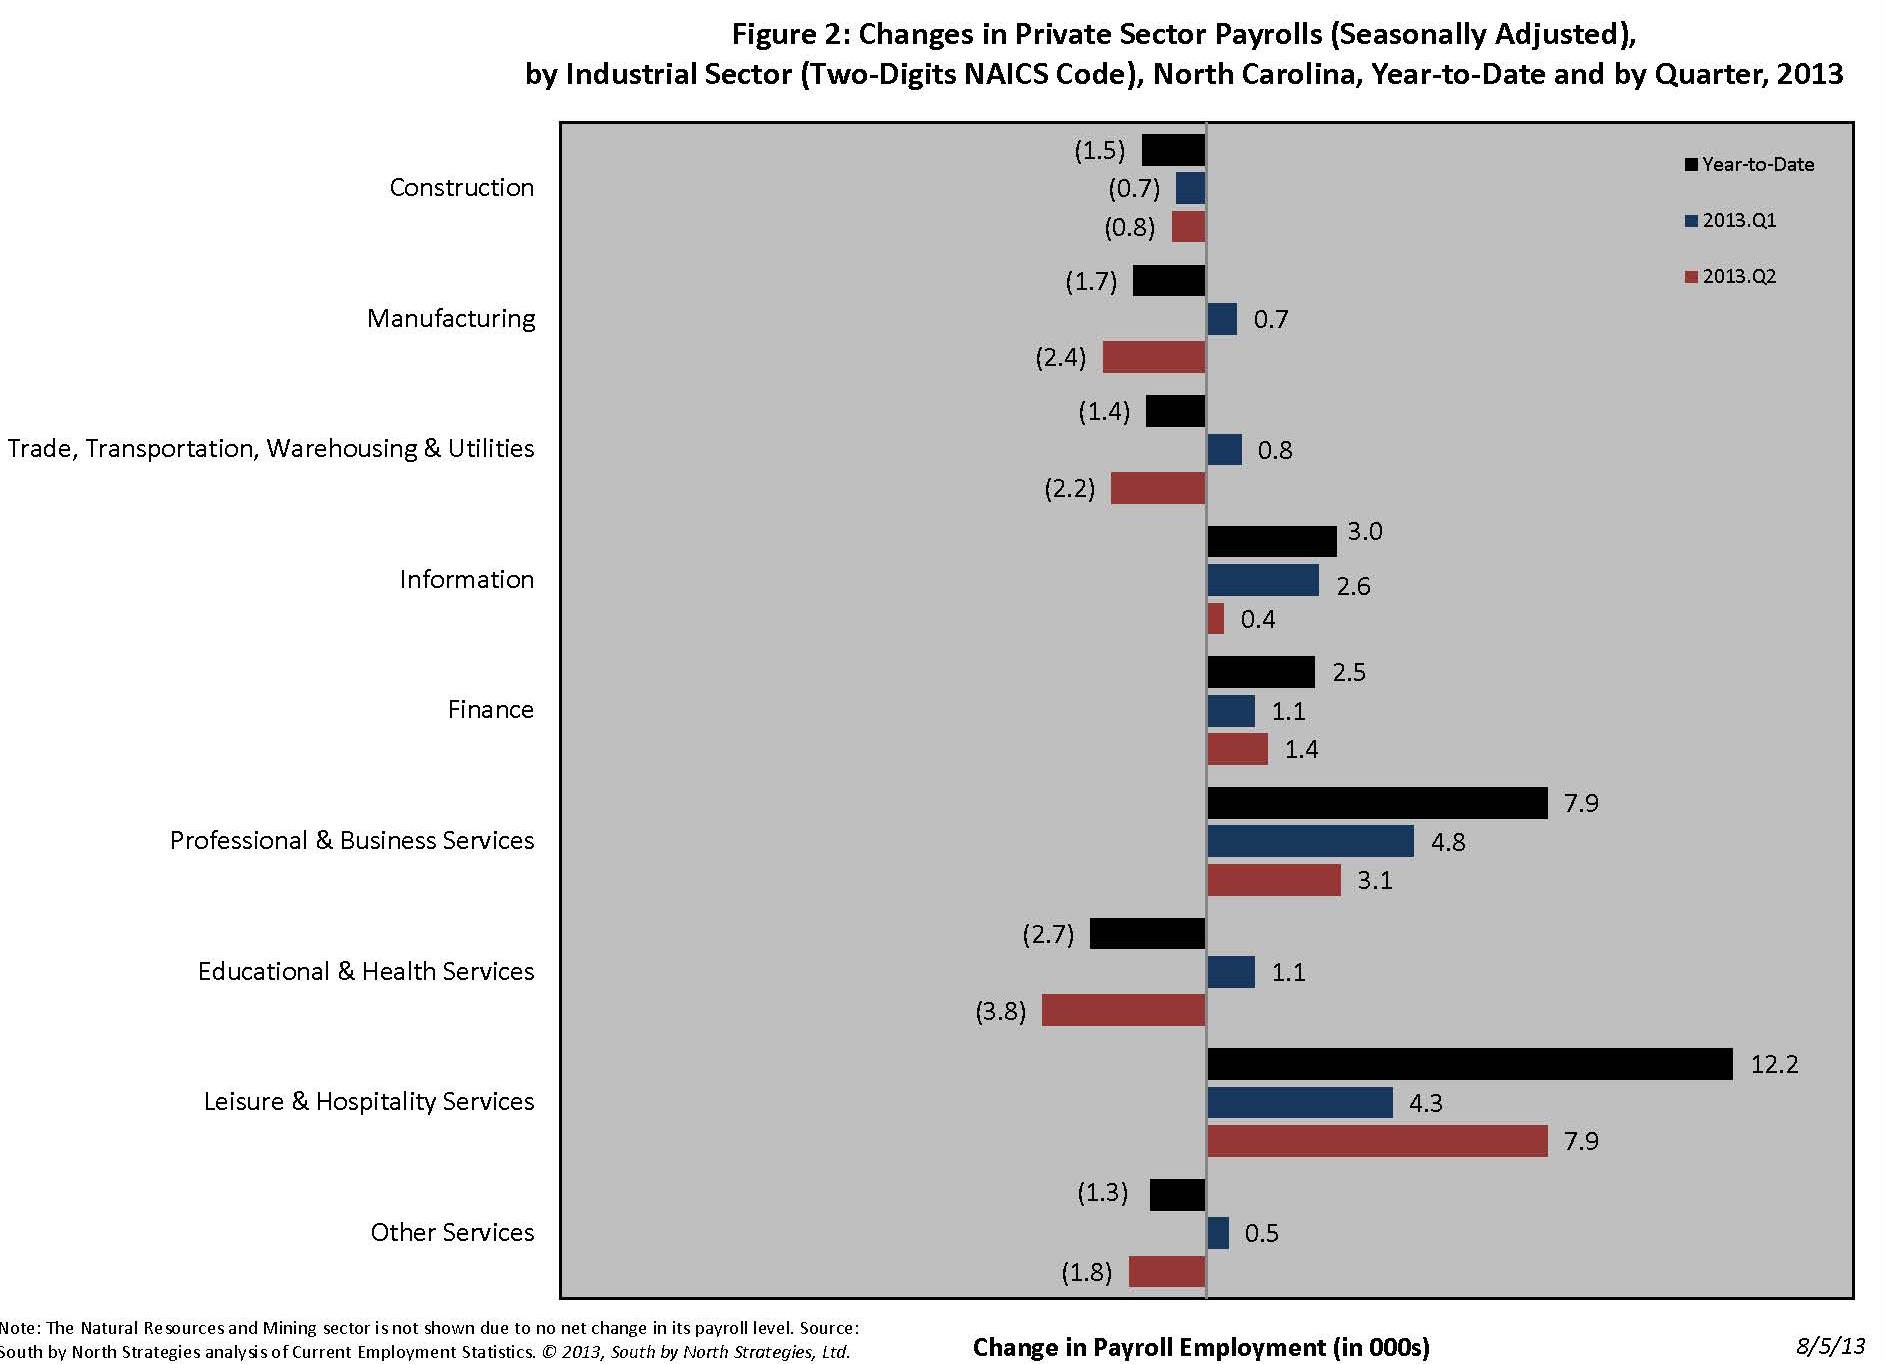
Job growth during the first part of 2013 did not occur uniformly across industries (fig. 2). The leisure and hospitality sector grew the most in absolute terms (+12,200 jobs, +2.9 percent); some 75.4 percent of that growth was attributable to the accommodation and food services subsector (+9,200 jobs, +2.5 percent). The next largest net increase was in the professional and business services sector (+7,900 jobs, +1.5 percent), with 77.2 percent of that growth originating in the administrative and waste management subsector. The information sector contributed 3,000 jobs (+4.3 percent) to the six-month net change, followed by the finance sector (+2,500 jobs, +1.2 percent.)
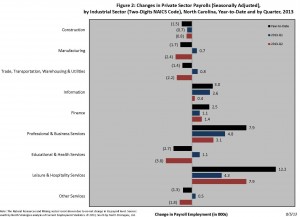
In terms of contracting private-sector industries, education and health services lost the most jobs in absolute terms (-2,700 jobs, -0.5 percent), followed by manufacturing (-1,700, -0.4 percent, with 70.6 percent of the decline linked to manufacturers of non-durable goods), construction (-1,500 jobs, -0.9 percent), trade, transportation, warehousing, and utilities (-1,400 jobs, -0.2 percent), and other services (-1,300, -0.9 percent).
Note that the industrial employment patterns seen since the February 2010 onset of a labor market recovery are inconsistent with the claim that joblessness is the result of mismatches between workforce skills and job requirements. Some 23.6 percent of the net private-sector job growth recorded between February 2010 and June 2013 occurred in the administrative and waste management (including temporary help services) subsector, while another 35.4 percent originated in the accommodation and food services (20 percent) and the retail trade (11.8 percent) industrial subsectors. All three of those fields generally employ significant numbers of workers with modest skill levels. They also are industries that tend to pay relatively low wages, offer few benefits, and provide little stability or predictability. Workers consequently tend to turn toward these industries when they have few other employment options.
A Sizable Job Gap Remains
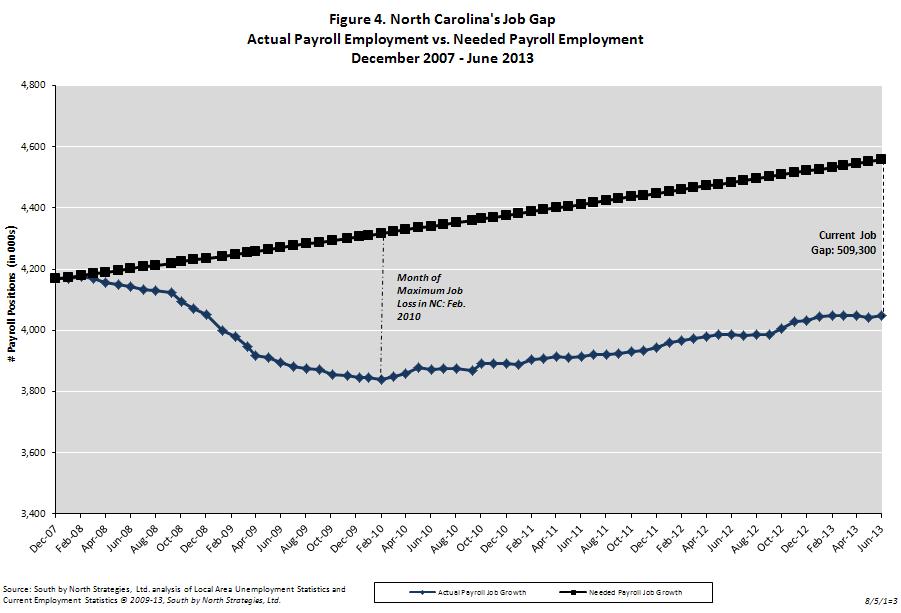
The weak job growth recorded during the first half of 2013 did little to replace the jobs lost earlier in the business cycle. From the onset of the “Great Recession” in December 2007 through June 2013, North Carolina lost, on net, 119,600 positions, or 2.9 percent of its payroll employment base. The maximum job loss recorded during the period occurred in February 2010, when the state had 327,800 fewer jobs (-7.9 percent) than it did 26 months earlier. Between then and June 2013, North Carolina netted an average of 5,200 payroll jobs per month, resulting in a cumulative gain of 208,200 positions (+5.4 percent).
While the state’s economy added more jobs than it lost during the first half of 2013, the rate of job growth was too subdued to alter materially the employment situation. Even if the North Carolina labor market succeeded in adding another 16,100 jobs during the second half of 2013 and then managed to replicate that gain every six months going forward, it would take through the end of 2016 to close the jobs gap that existed in June, holding all else equal.
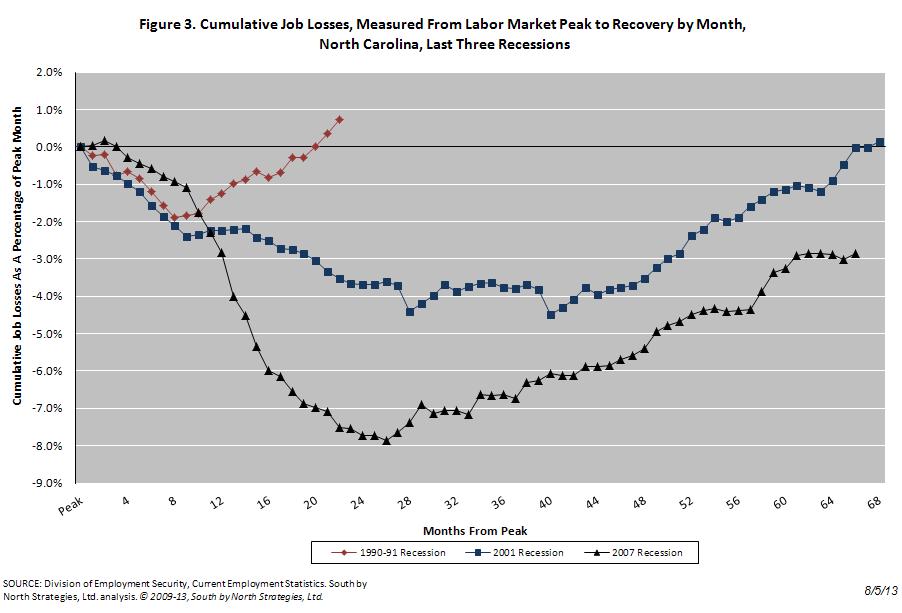
As fig. 3 shows, the job losses recorded during the Great Recession have proven more severe than the ones experienced during the 2001 and 1990-1991 recessions. At the height of the 2001 recession, the state lost 4.5 percent of its jobs base, and the comparable drop during the 1990-1991 recession was 1.9 percent. In both of those recessions, the job gap closed steadily after the peak losses were realized. During the current cycle, however, the peak contraction was greater, and the recovery has proven much slower.

To further understand the magnitude of the job gap facing North Carolina, consider how the state had only 111,800 more payroll jobs (+2.8 percent) in June 2013 than it had in June 2000, despite having a much larger economy. Between 2000 and 2012, the last year with complete data, economic output in North Carolina rose by 24.1 percent in inflation-adjusted terms. Moreover, the state has regained all of the economic output lost earlier in the Great Recession, and the statewide economy was, in real terms, 3.7 percent larger in 2012 than it was in 2007. Such growth, however, has not sparked job growth.
Remember, too, that the job shortfall facing North Carolina actually is larger than the one caused by the destruction of jobs during the recession. Between December 2007 and June 2013, the number of working-age persons residing in North Carolina grew by 8.9 percent. That means that the state should have added an estimated 390,000 jobs to keep pace with population growth. If one considers the jobs that should have been created since December 2007 but were not, the job gap facing the state in June 2013 was 509,000 positions (fig. 4).

To close that gap by June 2016, holding all else equal, North Carolina would need to net 14,100 jobs per month for each of the next 36 months — an average monthly net gain 2.7 times greater than the one experienced between February 2010 and June 2013. At no point since 1990 has North Carolina sustained such growth for so long. In fact, North Carolina has netted at least 14,000 payroll jobs in just 39 of the 282 months (13.8 percent) stretching from January 1990 to June 2013.
Unemployment Still Alarmingly Elevated
Weak job growth during the first half of 2012 did little to reduce the problems of unemployment and joblessness across North Carolina. The monthly number of unemployed Tar Heels (seasonally adjusted) averaged 431,126. Unemployment was higher in both absolute and relative terms during the first quarter of the year than in the second quarter. From January 2013 to June 2013, the statewide unemployment rate fell from 9.5 percent to 8.8 percent, which was the lowest level recorded since December 2008. That said, unemployment remained elevated by any objective measure. In June 2013, for instance, the statewide unemployment rate was almost double the rate posted in June 2007 (8.8 percent versus 4.7 percent), and the total number of unemployed persons was 96.7 percent larger.
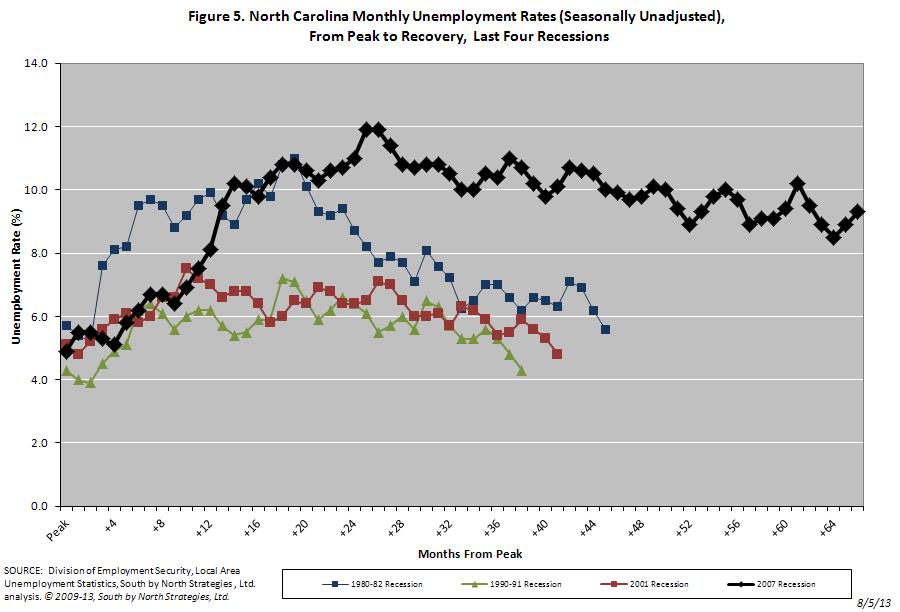
When judged in terms of the statewide unemployment rate (seasonally unadjusted), the recent recession has proven to be the longest and most severe of any post-1980 downturn (fig. 5). Between 1980 and 2008, the highest unemployment rate recorded in North Carolina was 11.3 percent in March 1983. During the same 28-year period, the unemployment rate exceeded 10 percent in four months, all in the early 1980s. Since February 2009, however, the seasonally unadjusted unemployment rate has exceeded 10 percent in 34 of 53 months (64.2 percent) and has fallen no lower than 8.8 percent.
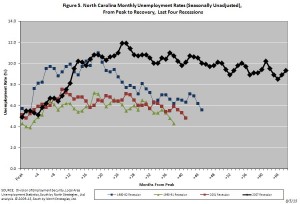
In every other post-1980 recession, the state unemployment rate had returned to its pre-recessionary level by 45 months following the onset of the downturn. Despite the passage of 66 months since the onset of the most recent recession, North Carolina’s seasonally unadjusted unemployment rate of 9.3 percent in June was 4.4 percentage points higher than the December 2007 level of 4.9 percent.
Unemployment Is One of Many Labor Market Problems
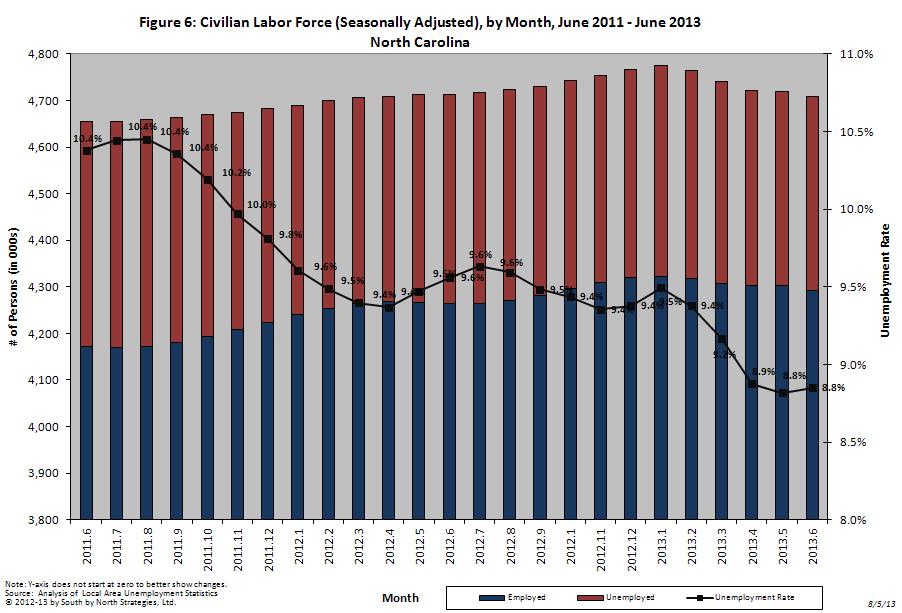
The size of the state’s civilian labor force (seasonally adjusted) contracted by 57,970 individuals (-1.2 percent) during the first half of 2013. In June 2013, the state’s labor force had 4,441 fewer individuals (-0.9 percent) than the year before, even though the number of working-age people in the state had grown by 78,000 individuals, or 1 percent (fig 6).
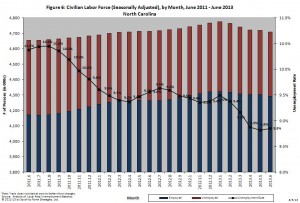
An important reason why the size of the labor force has held relatively constant despite steady growth in the population of working-age people is the sharp drop in the labor force participation rate, which measures the share of the working-age population that is employed or unemployed.
In June 2013, the state’s seasonally adjusted labor force participation rate equaled 62.2 percent, a rate that is both lower than then the 62.9 percent figure posted a year earlier and close to the 37-year low of 62.2 percent set earlier in the downturn. The depressed labor force participation rate indicates that many people of working age are not participating in the labor market, either by choice (e.g., retirees and homemakers) or due to discouragement. This suggests that joblessness is more widespread than reflected in the official unemployment rate.
To put the depressed labor force participation rate in context, consider how the rate equaled 67.5 percent in June 2000. If the rate had held constant, all else being equal, the number of employed and unemployed persons residing in North Carolina in June 2013 would have totaled 5,107,795 — a number 8.5 percent greater than the actual figure of 4,709,264. While the labor force participation rate likely should have dropped to some degree over the past 13 years due to demographic changes, the magnitude of the drop suggests that cyclical factors are at play.
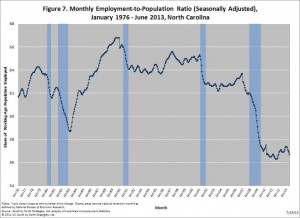
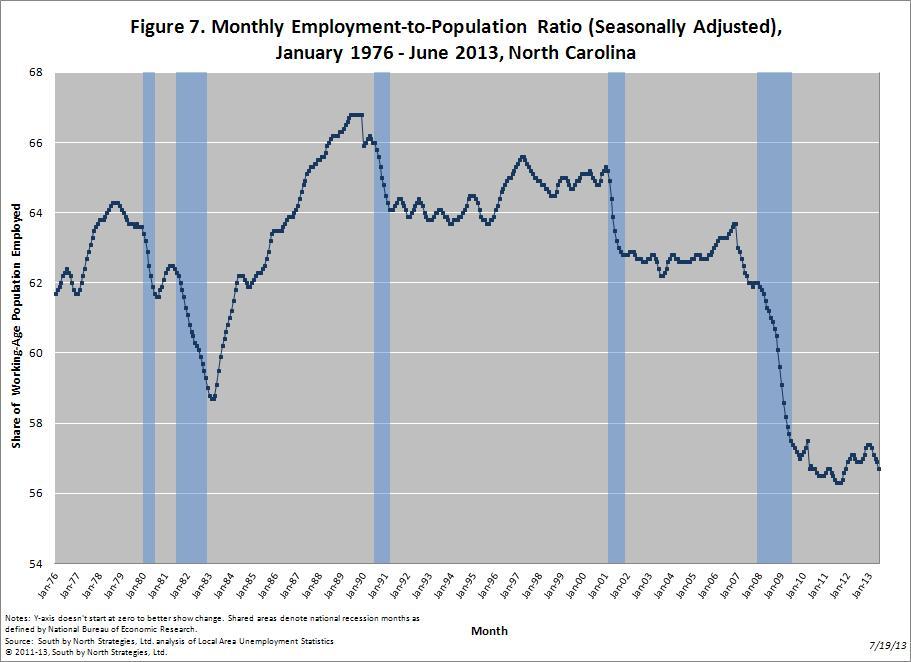
Two additional measures help to illustrate the extent to which labor currently is sitting idle in North Carolina. The first measure is the employment-to-population ratio, which reflects the share of the working-age population that is employed. In June 2013, the employment-to-population ratio in North Carolina was 56.7 percent, down from the 57.4 percent rate recorded in December 2012 and and the 56.9 percent figure posted a year earlier.
While the employment-to-population ratio has increased somewhat from the extraordinary low level of 56.3 percent experienced in the third quarter of 2011, the ratio remains near that 37-year low (fig. 7). If the rate in June 2013 had equaled the June 2000 figure of 65 percent, holding all else equal, the number of employed persons residing in North Carolina would have totaled 4,918,600 — a figure 4.4 percent greater than the actual one of 4,709,264.
The second important measure is the underemployment rate, which is a broader gauge of labor under-utilization prepared quarterly by the US Bureau of Labor Statistics. This statistic captures the share of the state’s adjusted labor force that was unemployed, working part-time despite wanting full-time work, or marginally attached to the workforce (due to discouragement or other reasons). During the second quarter of 2013, North Carolina’s underemployment rate equaled 15.6 percent, down slightly from the 16.2 percent rate posted in the first quarter of the year.
Regardless of the exact measure used, a sizable amount of labor in North Carolina was sitting idle in June. Almost nine of every 100 members of the state’s labor force were unemployed (seasonally adjusted), while almost 16 of every 100 persons in the adjusted labor force were underemployed. Compared to 13 years ago, more North Carolinians were unemployed in both absolute and relative terms in June, and smaller shares of the working-age population were employed or were even participating in the labor force.
The fundamental reason why so many potential workers are sitting on the labor market’s sidelines is a lack of jobs. According to the Job Openings and Labor Turnover Survey conducted by the US Bureau of Labor Statistics, the ratio of unemployed adults to available job openings in June 2013 in the South was 2.6-to-1 (state-level data are unavailable). In short, there simply were no jobs for almost two of every three unemployed Southerners in June.
Geographic Patterns of Unemployment
During the first half of 2013, labor market conditions remained weak across North Carolina. In June 2013, 44 counties had unemployment rates of at least 10 percent. Compared to a year earlier, unemployment rates were lower in 85 counties, higher in 12 counties, and unchanged in three counties. (All local figures are seasonally unadjusted.)
Labor markets in non-metropolitan communities remained particularly weak during the first part of 2013. In June 2012, the unemployment rate in non-metropolitan North Carolina was 10.3 percent, down from the 10.7 percent rate recorded one year earlier. The metropolitan unemployment rate also fell over the course of the year, dropping to 8.9 percent from 9.4 percent. Meanwhile, 8.6 percent of the combined labor force residing in the “Big Three” metro areas of Charlotte, the Research Triangle, and the Piedmont Triad was unemployed.
From the onset of the recession until June 2013, the size of North Carolina’s non-metro labor force rose by 1,364 individuals (+0.1 percent), while the metropolitan labor force gained 236,697 members (+7.5 percent). Within metro North Carolina, growth in the “Big Three” metros accounted for 71.5 percent of the total gain.
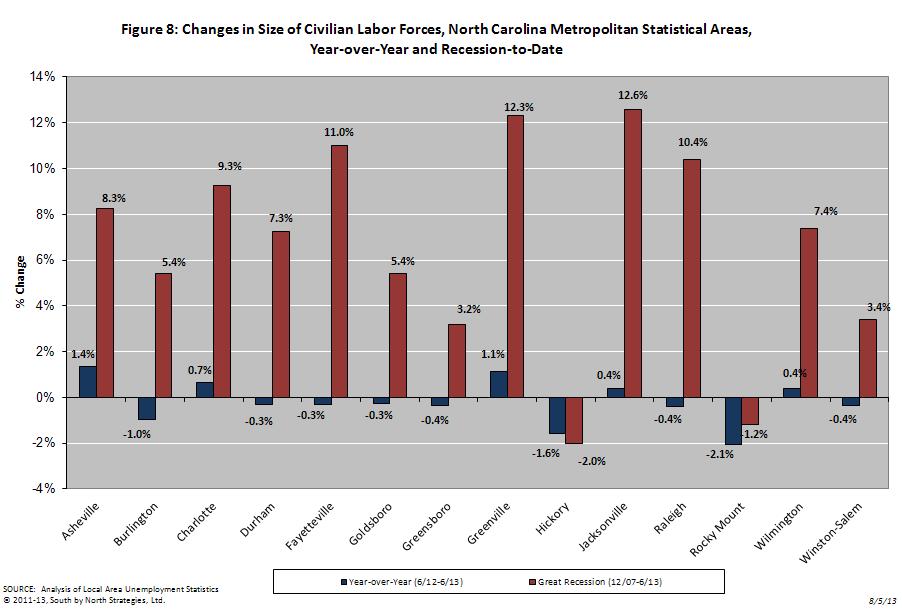
As fig. 8 shows, the labor market performances of North Carolina’s metro areas varied over the year. Nine of the state’s 14 areas recorded decreases in their labor forces, with the greatest declines occurring in the Rocky Mount (-2.1 percent) and Hickory-Morganton-Lenoir (-1.6 percent) metros. In contrast, Asheville’s labor force grew by 1.4 percent, followed by the Greenville metro (+1.1 percent). Since the start of the recession, the greatest rates of labor force growth have occurred in Jacksonville (+12.6 percent) and Greenville (+12.3 percent), followed by Fayetteville (+11 percent) and Raleigh-Cary (+10.4 percent).
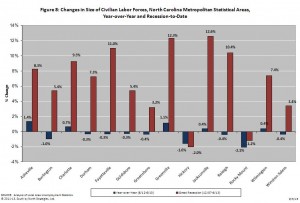
At 7.1 percent, Asheville had the lowest metro unemployment rate in June 2013. Next came Durham-Chapel Hill (7.3 percent), Raleigh-Cary (7.5 percent), Winston-Salem (8.7 percent), Goldsboro (9.2 percent), and Charlotte (9.3 percent). The highest rates were in Rocky Mount (13.3 percent), Hickory (10.5 percent), and Fayetteville (10.4 percent).
When looking at local unemployment numbers, it is important to place them in perspective. The 7.1 percent unemployment rate found in the Asheville metro in June, for instance, was low relative to the performance of other North Carolina metros, yet it is was high by any objective standard. Consider how in June 2008 just 4.9 percent of Asheville’s labor force was unemployed. Five years later, the area’s unemployment rate was 2.2 percentage points higher, while the number of unemployed residents was 51.4 percent larger. Despite faring better than other metros in the state, Asheville’s labor market hardly can be called robust.
Cloudy Prospects
The first half of 2013 proved highly disappointing for North Carolina’s labor market. While the year began on a positive note thanks to hiring in the private sector during the year’s first quarter, growth ground to a halt in the second quarter. The resulting net gain of 16,100 payroll jobs was the worst first-half gain in both absolute and relative terms recorded since the onset of the recovery. If the trends continue during the second half of the year, 2013 will be the worst year for job growth in North Carolina since the advent of the recovery.
While the statewide unemployment rate did fall during the first half of the year and now is the lowest rate posted since late 2008, the decline was intertwined with a movement of people out of the labor force. Compared to December 2012, some 30,300 fewer North Carolinians were unemployed (-6.8 percent), but the number of employed persons also fell over the same period. Compared to the start of the year, 27,700 fewer North Carolinians now have jobs (-0.6 percent). The decline in the unemployment rate therefore is attributable to a contraction in the size of the labor force rather than improved employment prospects for North Carolinians.
In sum, the current rate of job growth in North Carolina is insufficient to close the state’s sizable job gap anytime soon. The problem of mass joblessness consequently should endure, even if the extent of the problem is being masked to some degree by a decline in the unemployment rate. Some 5.5 years after the onset of the Great Recession, a full recovery for North Carolina’s labor market remains a distant goal.
#####
Individuals with a printed copy of this analysis may access it online at http://www.sbnstrategies.com/?p=13278 or by scanning the QR code below.

All materials within this analysis Copyright © 2013 by South by North Strategies, Ltd.
02.08.2013
News Releases, Policy Points
CHAPEL HILL, NC (August 2, 2013) – The national labor market added in July 162,000 more jobs than it lost. While the unemployment rate and number of unemployed persons fell over the month, joblessness remained pervasive throughout the country. Last month, 11.5 million Americans were unemployed, while 8.2 million individuals worked part time despite preferring full-time positions. Another 988,000 individuals (not seasonally adjusted) were so discouraged about their job prospects that they had stopped searching for work altogether.
“July was the 34th-straight month of job growth recorded in the United States,” said John Quinterno, a principal with South by North Strategies, Ltd., a research firm specializing in economic and social policy. “Over the past year, the national economy netted an average of 190,000 jobs per month, a pace that, while positive, is insufficient to drive unemployment down to pre-recessionary levels. The pace of growth slowed sharply during the past three months, falling to an average monthly net gain of 175,000 jobs, compared to an average of 224,000 jobs per month during the prior three-month period.”
In July, the nation’s employers added 162,000 more payroll positions than they cut. Gains occurred almost entirely in the private sector (+161,000), while government employers added 1,000 more positions than they eliminated. Furthermore, the payroll employment numbers for May and June underwent negative revisions; with the updates, the economy gained 364,000 jobs over those two months, not the 390,000 positions previously reported.
Within the private sector, payroll levels rose the most in the trade, transportation, and utilities sector (+63,000, with 74.3 percent of the gains occurring in the retail trade subsector), followed by the professional and business services sector (+36,000, with 58.6 percent of the gain occurring in the professional and technical services subsector) and the leisure and hospitality services sector (+23,000, with all of the gain attributable to the accommodation and food services subsector). Payroll levels fell the most in the construction and other services sectors (-6,000 and -2,000, respectively).
“Since last July, the American economy has gained 2.3 million more payroll positions that it has lost,” noted Quinterno. “The current average monthly rate of job growth—some 190,000 positions per month—is insufficient to close the nation’s sizable jobs gap anytime soon.”
Slack labor market conditions were evident in the July household survey. Last month, 11.5 million Americans (7.4 percent of the labor force) were jobless and seeking work. Both the unemployment rate and total number of unemployed persons were lower when compared to the prior month. In July, the share of the population participating in the labor force was essentially unchanged at 63.4 percent, a rate lower than the one posted a year ago. On a positive note, more Americans were working in July compared to a year earlier, and fewer persons were unemployed. At the same time, the share of the working-age population with a job remained near the lowest figure recorded during the current business cycle.
Last month, the unemployment rate was higher among adult male workers than female ones (7 percent versus 6.5 percent). Unemployment rates were higher among Black (12.6 percent) and Hispanic workers (9.4 percent) than among white ones (6.6 percent). The unemployment rate among teenagers was 23.7 percent. Moreover, 6.4 percent of all veterans were unemployed; the rate among recent veterans (served after September 2001) was 7.7 percent. At the same time, 14.7 percent of Americans with disabilities were jobless and seeking work (not seasonally adjusted).
Jobs remained hard to find in July. Last month, the underemployment rate equaled 14 percent. Not only were 11.5 million Americans unemployed, but 8.2 million people held part-time jobs despite preferring full-time work; while another 988,000 individuals (not seasonally adjusted) were so discouraged about the labor market that they had stopped searching for work. Among unemployed workers, 37 percent had been jobless for at least six months, and the average spell of unemployment lasted 36.6 weeks. The leading cause of unemployment remained a job loss or the completion of a temporary job, which was the reason cited by 51.9 percent of unemployed persons. Another 28.5 percent of unemployed persons were re-entrants to the labor market, while 11 percent were new entrants. Voluntary job leavers accounted for the remaining 8.6 percent of the total.
“The July employment report provided additional evidence of a sagging labor market,” observed Quinterno. “Job growth slowed and underemployment remained elevated. Despite the drop in the unemployment rate to the lowest level recorded since November 2008, joblessness and the associated hardships remain pervasive throughout the United States.”


 Email Sign-Up