Policy Points
07.01.2010
Policy Points
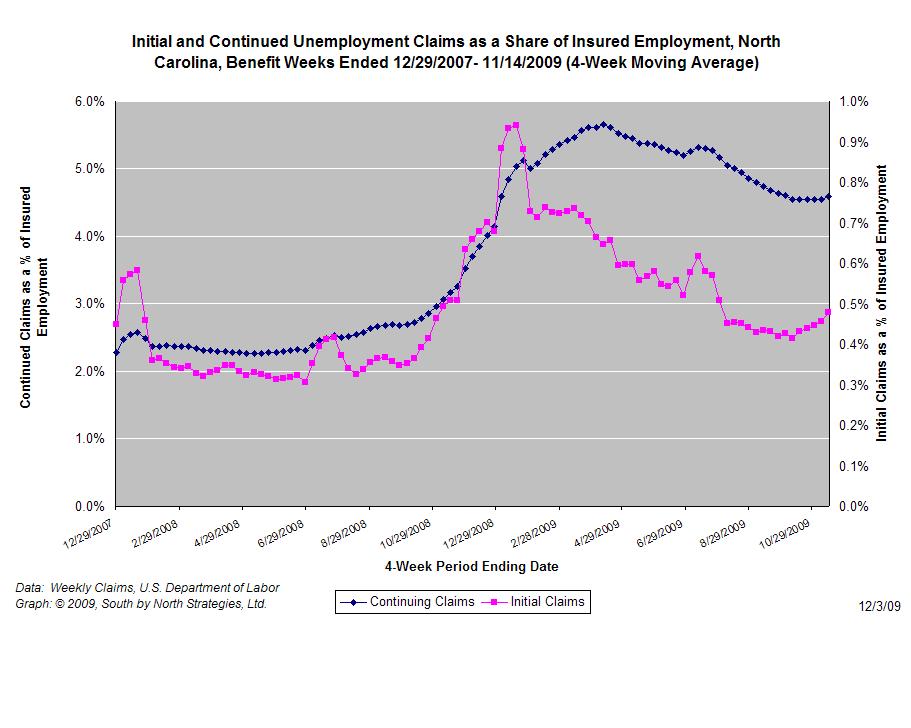
For the benefit week ending on December 19th, 13,230 North Carolinians filed initial claims for state unemployment insurance benefits, and 185,313 individuals applied for state-funded continuing insurance benefits. Compared to the prior week, there were fewer initial and continuing claims. (The filing week, however, had fewer business days due to the Christmas holiday.) These figures come from data released today by the U.S. Department of Labor.
Averaging new and continuing claims over a four-week period — a process that helps adjust for seasonal fluctuations and better illustrates trends — shows that an average of 19,954 initial claims were filed over the last four weeks, along with an average of 193,955 continuing claims. Compared to the previous four-week period, initial claims were lower, continuing claims higher.

One year ago, the four-week average for initial claims stood at 28,106 and the four-week average of continuing claims equaled 161,112.
The graph (right) shows the changes in unemployment insurance claims (as a share of covered employment) in North Carolina since the recession’s start in December 2007.
Although new and continuing claims appear to have peaked for this business cycle, the claims levels remain elevated and point to a labor market that remains extremely weak. Especially troubling is the high level of continuing claims, which suggests that unemployed individuals are finding it extremely difficult to find new positions.
07.01.2010
Policy Points
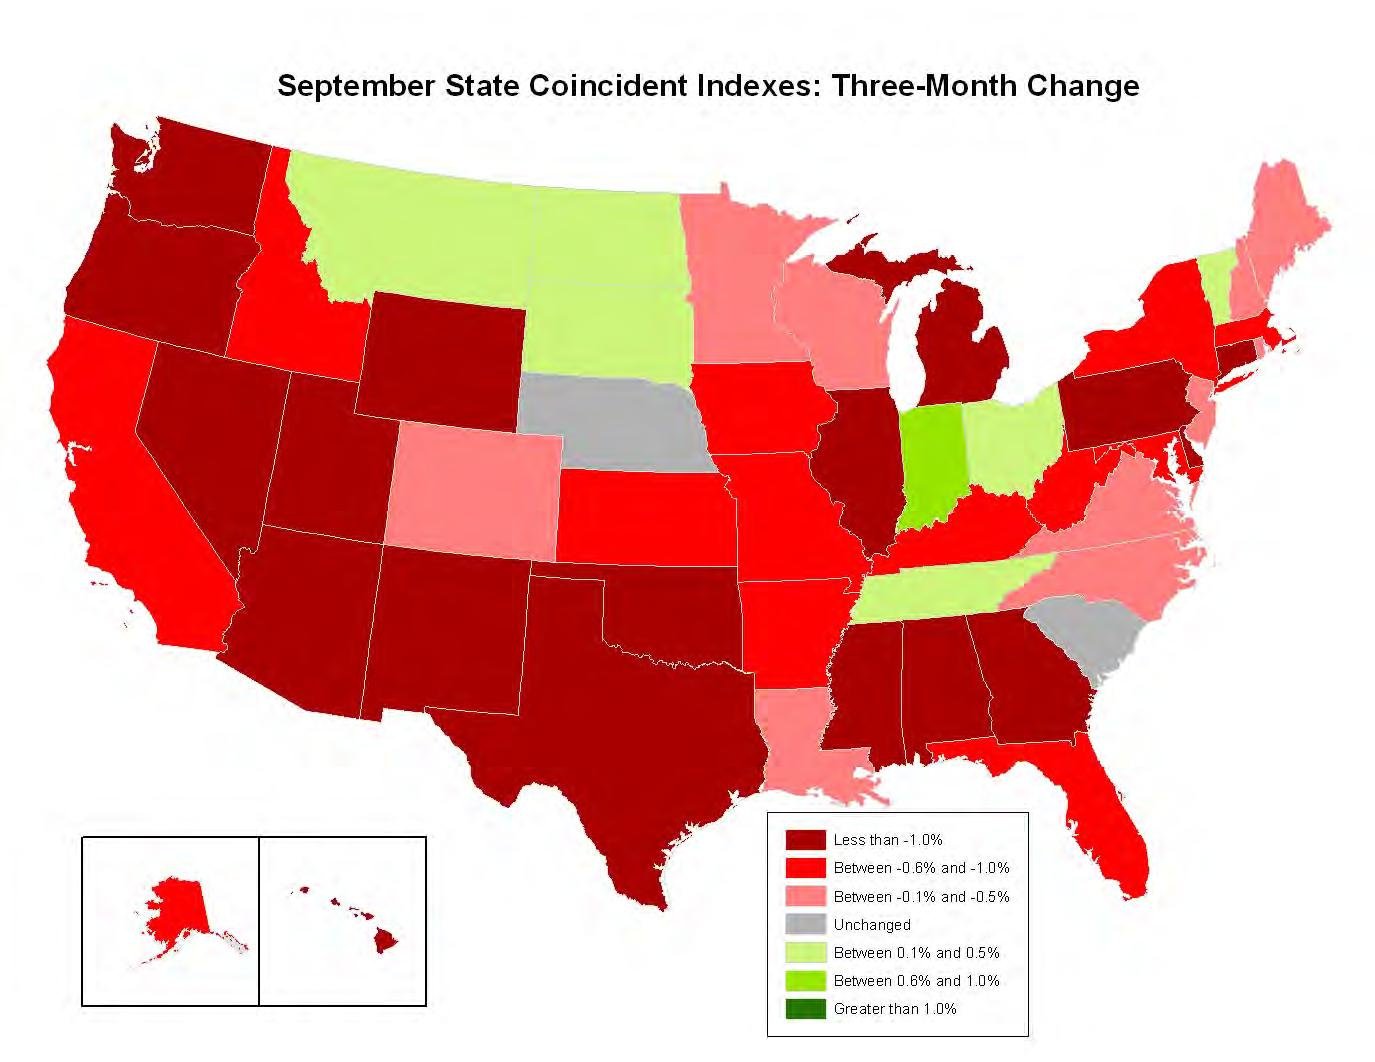
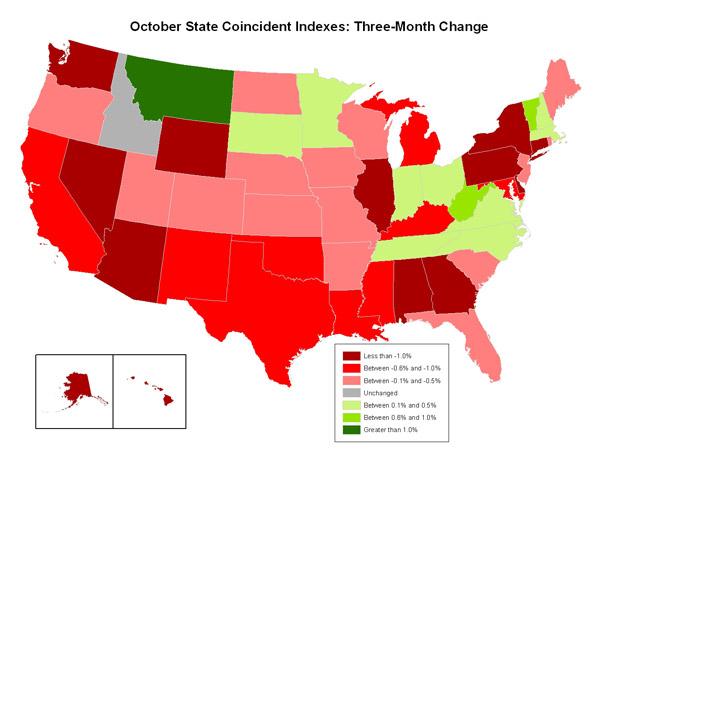
Economic conditions remained weak across much of the nation in November, according to the newest State Coincident Indexes Report prepared by the Federal Reserve Bank of Philadelphia.
In November coincident indexes moved in a negative direction in 16 states and in a positive direction in 26 states. No changes occurred in eight states (CO, ID, IN, LA, NJ, OK, OR, and UT).
 The map to the right, which is taken from the Reserve Bank’s survey, shows the three-month changes in coincident indicators by state. Positive numbers denote improvements in economic conditions, and negative numbers refer to declines.
Over the last three months, coincident indexes decreased in 25 states, rose in 20 states and held steady in five states.
During the same three-month period, North Carolina’s coincident index moved in a slightly positive direction, suggesting that economic conditions improved slightl
06.01.2010
Policy Points
Economic policy reports, blog postings, and media stories of interest:
06.01.2010
Policy Points
Many analyses of the impact of the American Recovery and Reinvestment Act (ARRA) on the nation’s Gross Domestic Product (GDP) have confused GDP levels and GDP growth rates. Typically, the mistake is to say that two-thirds of ARRA funds are yet to be spent and when they are, they will boost GDP growth. That is not so. While the remaining ARRA funds will influence GDP levels, the package already has had its maximum impact on GDP growth. And as elements of ARRA and other forms of government aid are withdrawn in 2010, GDP growth rates will slow and likely turn negative in late 2010 and early 2011.

At his blog, economist Paul Krugman uses the following stylized example (right) to illustrate that pattern. In the chart, “rate” measure total ARRA spending in a quarter; “change” reflects the change in ARRA spending over the preceding quarter, and “cumulative” measures total ARRA spending to date.
Using this example, ARRA will exert its maximum impact on GDP levels in the third quarter of 2010, yet it had its maximum effect on GDP growth in the third quarter of 2009. As time passes and ARRA provisions expire, GDP growth rates will slow and then turn negative in late 2010 and remain negative into early 2011. (This example tracks forecasts by analysts at Deutsche Bank).
It is this trend that is causing some analysts to doubt the sustainability of the current recovery and to warn about a possible “double dip” recession in late 2010 or early 2011.
Yet this pattern does not mean that ARRA was ineffective. As economist Menzie Chinn writes at Econbrowser:
In other words, even as the stimulus subtracts from growth starting in the second half of 2010, the level of GDP is still higher than what would be the case in the absence of the stimulus package. Critics of the stimulus package often neglect to highlight that point.
06.01.2010
Policy Points
In October, the seasonally-adjusted home prices of single-family units rose in 11 of the 20 metro areas tracked by the S&P/Case-Shiller Housing Price Indicies. Despite those increases, sales price levels in all 20 markets remain significantly lower than they were one year ago.
The graph (right) shows changes in price indices for selected metros. Data are shown for Charlotte, certain peer metros in the South Atlantic, and, for purposes of regional comparisons, San Diego and Cleveland. The composite measure for all 20 metros also is shown.
While Charlotte never experienced the same housing bubble seen in other metros, housing prices, as measured by the index, have fallen by 7.1 percent over the past year and by 10.9 percent since the start of the recession. And Charlotte was one of 11 metros tracked in the survey that recorded a month-to-month decline in prices. Although most of the price tracked by the S&P/Case-Shiller Indicies have risen over the past few months, those trends don’t necessarily mean that the housing bubble has fully deflated. Explains Calculated Risk:
The impact of the massive government effort to support house prices led to small increases in prices over the Summer, and the question is what happens to prices as these programs end over the next 6 months.


 Email Sign-Up