

August A Rough Month For Local Job Markets
CHAPEL HILL (September 23, 2011) – Between August 2010 and August 2011, unemployment rates rose in 76 of North Carolina’s 100 counties and in 11 of the state’s 14 metropolitan areas. At the same time, 49 counties and 10 metros had labor forces in August that were smaller compared to one year ago. These findings come from new estimates from the Employment Security Commission.
“Employment conditions deteriorated across much of North Carolina over the past year,” said John Quinterno, a principal with South by North Strategies, Ltd., a research firm specializing in economic and social policy. “In many places, unemployment is more pronounced than was the case in August 2010. Many local job markets simply have shown no signs of improvement.”
Since the economy fell into recession in December 2007, North Carolina has lost, on net, 6.9 percent of its payroll employment base (-289,300 positions) and has seen its unadjusted unemployment rate climb from 4.7 percent to 10.4 percent. In August, the state gained 16,500 more payroll jobs than it lost. Since bottoming out in February 2010, the state has netted an average of 1,872 jobs per month, leading to a cumulative gain of just 33,700 jobs (+0.9 percent).
Between July and August, unemployment rates rose in 47 counties, held steady in 21 counties, and fell in 32 counties. Unemployment rates were at or above 10 percent in 70 counties. Individual county rates ranged from 4.5 percent in Currituck County to 17.6 percent in Scotland County. Compared to a year ago, unemployment rates were higher in 76 counties, unchanged in 3 counties, and lower in 21 counties.
“Non-metropolitan labor markets remained particularly weak in August,” added Quinterno. “Last month, 11.4 percent of the non-metro labor force was unemployed, compared to 10.1 percent of the metro labor force. Over the year, the size of the rural labor force and the number of employed rural residents rose slightly, but the number of unemployed individuals rose as well, which caused the unemployment rate to increase. When compared to December 2007, the non-metro labor force now is 2.7 percent smaller. Similarly, the number of unemployed individuals has doubled, while the number of employed persons has fallen by 8.7 percent.”
Last month, unemployment rates rose in 10 of the state’s metropolitan areas. Rocky Mount had the highest rate (13.6 percent), followed by Hickory-Morganton-Lenoir (12.5 percent). Durham-Chapel Hill had the lowest rate (8.2 percent), followed by Asheville (8.4 percent).
Compared to August 2010, unemployment rates were higher in 76 counties and 11 metros. Moreover, 49 counties and 10 metros had smaller labor forces. Among metros, Hickory-Morganton-Lenoir (-2.2 percent) recorded the largest decline in the size of its labor force, followed by Asheville (-1.4 percent). Rocky Mount posted the largest increase (+2.9 percent), followed by Fayetteville (+2.3 percent), and Winston-Salem (+1.5 percent).
In the long term, any meaningful recovery will hinge on growth in the state’s three major regions: Charlotte, the Research Triangle, and the Piedmont Triad. Yet growth remains sluggish. Collectively, employment in these three metro regions has fallen by 4.8 percent since December 2007, and the combined August unemployment rate in the three metros equaled 9.9 percent. Of the three, the Research Triangle had the lowest unemployment rate (8.8 percent), followed by the Piedmont Triad (10.7 percent), and Charlotte (11.4 percent).
“Labor market condition worsened across much of North Carolina over the past year,” said Quinterno. “Private-sector job growth remains sluggish, and the gains that are occurring are being erased by public-sector cuts. So far this year, public-sector cuts have offset 26 percent of the private-sector gains recorded in the state. Many labor market indicators are moving in the wrong direction and are offering little evidence that improvements are likely to occur later in the year.”
NC Unemployment Claims: Week of 9/3/11
For the benefit week ending on September 3, 2011, some 12,630 North Carolinians filed initial claims for state unemployment insurance benefits, and 105,655 individuals applied for state-funded continuing benefits. Compared to the prior week, there were more initial and fewer continuing claims. These figures come from data released by the U.S. Department of Labor.
Averaging new and continuing claims over a four-week period — a process that helps adjust for seasonal fluctuations and better illustrates trends — shows that an average of 11,029 initial claims were filed over the previous four weeks, along with an average of 106,335 continuing claims. Compared to the previous four-week period, the average number of initial claims was higher, while the average number of continuing claims were lower.
One year ago, the four-week average for initial claims stood at 11,982 and the four-week average of continuing claims equaled 124,362.
While the number of claims has dropped over the past year so has covered employment. Last week, covered employment totaled 3.7 million, down from 3.8 million a year ago.
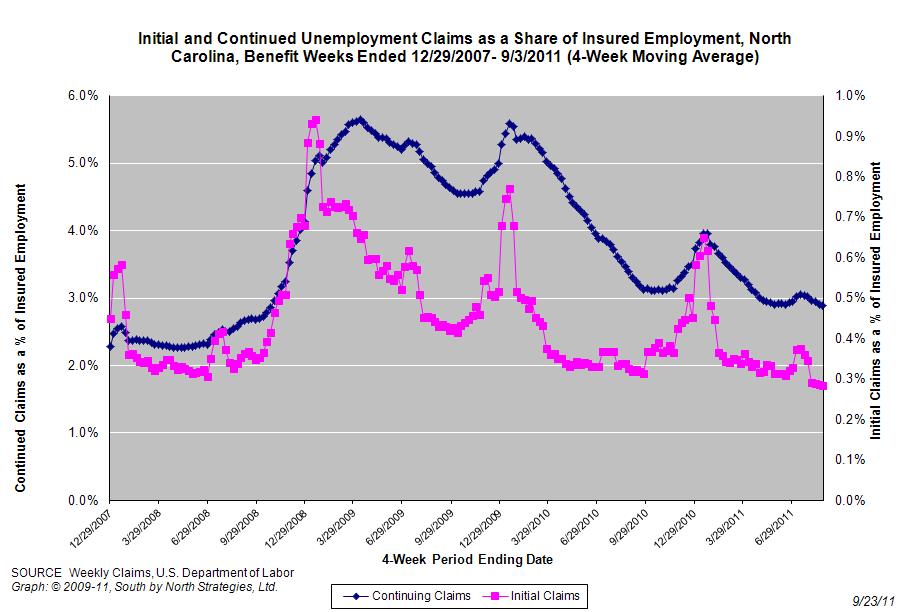 The graph shows the changes in unemployment insurance claims (as a share of covered employment) in North Carolina since the recession’s start in December 2007.
Both new and continuing claims appear to have peaked for this cycle, and the four-week averages of new and continuing claims have fallen considerably. Yet continuing claims remain at an elevated level, which suggests that unemployed individuals are finding it difficult to find new positions.
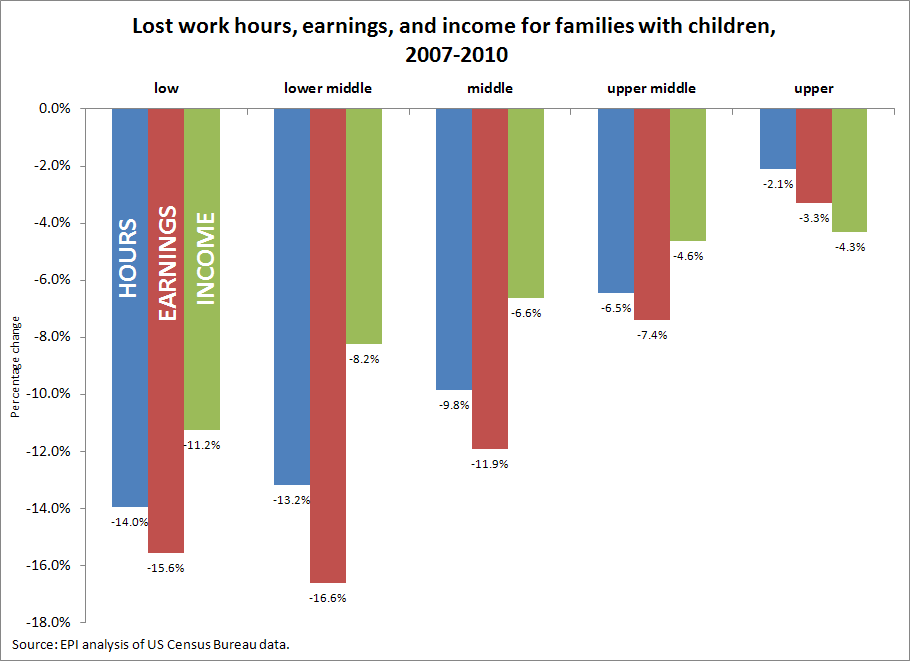
Falling Hours, Falling Incomes
Working Economics points out that reductions in available work hours have been responsible for much of the decline in income experienced by low- and moderate-income families with children.
Around The Dial – September 22, 2011
Economic policy reports, blog postings, and media stories of interest:
- Rakim Brooks discusses the economic problems facing Black and Latino communities.
- Bruce Bartlett discusses historical changes in tax expenditures.
- Fed Watch points out that it is “not the 1970s.”
- Annie Lowery explains “why small businesses aren’t innovative.”
- Dana Milbank thinks about the “job creator” argument.
More Than A Technical Change
A new paper from the Center for Economic and Policy Research analyzes the impact that changes to the cost of living adjustments used within the Social Security program would have on the living standards of older Americans. From the report …
Proposals to reduce the annual cost of living adjustment for Social Security by changing the indexation formula are likely to lower the living standards of retirees. The effect of this reduction would be to lower the real value of benefits by approximately 3 percent after workers have been collecting benefits for 10 years, 6 percent after 20 years, and 9 percent after 30 years. The evidence from the reduction in benefits that resulted from changes in the consumer price index in the 1990s indicates that retirees did not change their work or saving behavior to offset this reduction in benefits. The Social Security share of retirement income actually rose for most groups, even though the size of the benefit was smaller relative to the lifetime earnings.
…
It is also important to recognize that benefits, relative to lifetime earnings, have already been cut for those retiring this year or in the near future. This is due in part to changes in the consumer price index that already cause it to show a rate of inflation that is at least 0.5 percentage points annually lower relative to the true rate of inflation than the consumer price index that was in place in the 1980s. The phase-in of the increase in the age of receiving normal benefits from 65 to 67 also reduces benefits. In addition, this group of near retirees has paid a considerably higher share of their wage income as Social Security taxes.
 Email Sign-Up
 RSS Feed